


homes could be powered by the current installed solar capacity in the U.S.
Calculating the Number of Homes Powered by Solar Energy
The U.S. solar industry is growing at an unprecedented rate. Over the last 10 years, the solar industry has gone from installing less than 6 GWdc in 2013 to over 40 GWdc in 2023. With nearly 220 GWdc of cumulative solar electric capacity, solar energy generates enough clean electricity to power more than 36.7 million average American homes.
As solar becomes a more significant piece of the U.S. energy generation mix, it is important to understand just how many homes a megawatt of solar capacity can power. Below, we share how SEIA estimates the number of homes powered per megawatt of installed solar capacity, both photovoltaic (PV) and concentrating solar power (CSP), and the variables that need to be considered in this calculation. For the purposes of these estimates we use “power” not in the instantaneous sense but rather in the total annual electric power consumption sense.
Variables for Homes-Powered Calculations
The two key figures of this calculation are the annual electricity generation from solar in a state, in megawatt-Hours (MWh) and the average MWh consumed annually by average households in that state. How much electricity a state’s solar fleet generates depends on how much solar is installed in each state. This figure varies on a per-megawatt basis as well. Climate factors like average sunshine, temperature, and wind, play a major role in the productivity of solar, as do the design of the system itself (rooftop vs ground-mount, fixed-tilt vs tracking, etc).
To better account for the differences in performance by system type, SEIA’s estimates of annual generation are broken out by market segment. Residential rooftop systems, for instance, can be constrained by the angle of the roof or nearby tree cover. As a result, these systems, on average, generate less electricity per MW than utility-scale systems, which are typically sited under more optimal conditions and increasingly have dual-axis tracking systems with bifacial modules. When calculating the number of homes powered by U.S. solar, SEIA considers average generation factors (MWh/MW) at both the state and segment levels.
System Performance Variance
For the purposes of these calculations, SEIA uses both generation and capacity data from Electric Power Monthly. To account for the seasonal change in solar performance, calculations represent a 12 month rolling average, currently spanning April 2023 to March 2024.
Electricity Consumption per Household by State
Electricity consumption varies significantly across all states due in part to differences in demographics, home size and characteristics, and weather. For example, a homeowner in a state like North Carolina–with hot, humid, and long summers—uses more than twice as much electricity each year compared to a homeowner in New York State with shorter and relatively cooler summers.
Calculating Homes per Megawatt
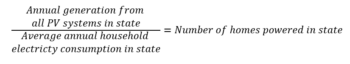
The average number of homes per megawatt of PV for a given state is simply the quotient of the capacity-weighted (weighted across fleet size for each market segment) average PV system performance estimate and the average annual household consumption. The graphic below outlines the homes/MW methodology for NY. This calculation was repeated for every state.

Due to differences in PV system performance and annual energy consumption per household, the number of homes powered by a MW of solar can vary significantly from state to state. The chart below shows the average number of homes powered by a MW of solar in some of the main solar markets across the country.
National Average Homes/MW Methodology
The current national average (through Q1 2024) of homes powered by a MW of solar is 172. Since SEIA began calculating this number in 2012 it has line with the market share of system types and the geographic distribution of solar PV systems. As utility-scale systems have taken on a greater share of total PV capacity, it has put upward pressure on the homes/MW number because those systems generally have higher yields than rooftop systems. Conversely, as the solar PV market diversifies and California’s share of total capacity decreases, more states that have higher average household electricity consumption have pushed the average homes/MW down. As these and other trends continue to emerge, we can expect continued minor adjustments to the homes/MW number.
The methodology behind the national average calculation includes the following steps:
- First, the total number of homes powered by PV within each state was calculated.
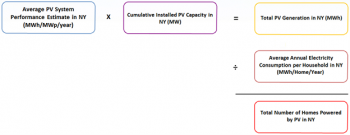
- The first step in calculating the total number of homes powered within a state was to determine the total average generation from a MW of solar in a particular market segment (residential, non-residential, or utility-scale), using solar generation and solar capacity figures from EIA. This factor was then applied to the latest capacity figure for that state market, using data from the most recent Solar Market Insight Report.
- Then, the total PV generation was divided by the average annual electricity consumption per household within the respective state. The quotient is the total number of homes powered by PV within the state.
The flow chart below outlines the step-by-step process used to calculate the total number of homes powered by PV in New York. This process was repeated for all 50 states.
Once the total number of homes powered by PV was calculated in every state, the totals were summed to show the national total number of homes powered by PV. The national total was then divided by the national cumulative installed PV capacity. The quotient is the national average number of homes powered by a MW of PV. The flow chart below outlines the final step in the methodology.

EIA reports solar energy capacity in MWac, and SEIA uses the following factors to convert to MWdc:
Residential: 1MWac=1.21MWdc
Non-residential: 1MWac=1.25MWdc
Utility-scale: 1MWac=1.3MWdc
resources
All Resources ->Additional SEIA Research

