U.S. Corporate Solar Projects Map
Share


top20map.jpg
(105.76 KB)
SMB_Map_Screenshot.jpg
(200.44 KB)
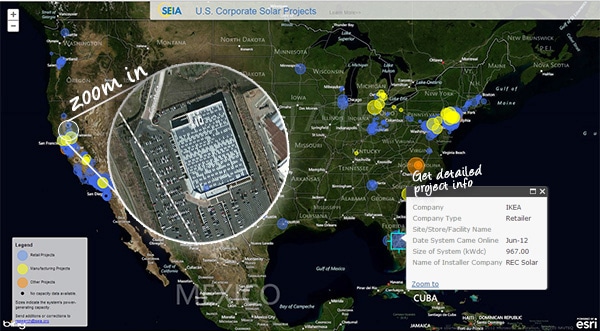
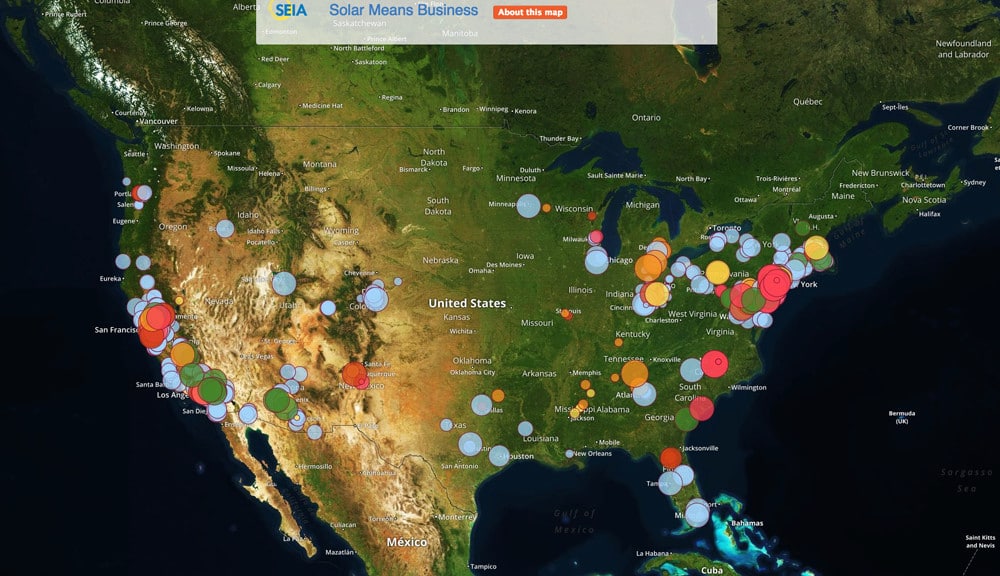
<p>See where the top corporations in the U.S. have installed solar. Our U.S. Corporate Solar Projects map was developed using the research from the <a href="/solarmeansbiz">Solar Means Business</a> Report.</p><p>Click on the image below to view the map full screen. Zoom in to view the projects via satellite imagery.</p><p><a href="http://www.seia.org/map/corporate-solar-projects.php"><img alt="" src="http://www.seia.org/sites/default/files/SMB_Map_Screenshot.jpg" style="width: 600px; height: 346px;" /></a></p><h2>About the Map</h2><p>To learn more about commercial users of solar energy, see <a href="http://www.seia.org/solarmeansbiz">Solar Means Business 2016</a>.</p><p>Covering corporate solar installs now in 38 states plus Washington D.C. and Puerto Rico, the 2016 Solar Means Business report tracks nearly 1,100 MW of solar installations at America’s top companies. To put that in context, that’s enough electricity to power the equivalent of 193,000 homes every year. Also noteworthy, in just the first three quarters of 2016, the report found 142 MW of corporate solar was added in the U.S., more than was installed in all of 2015 (129 MW).</p><p>Developed by the Solar Energy Industries Association</p><p>Last updated: October 2016</p><p>If you would like to provide data on your company's solar portfolio, please contact SEIA's Research Department at <a href="mailto:[email protected]>[email protected]</a>.</p>
Resource Type
Publisher
Solar Energy Industries Association
Browse Resources by Related Topics: