Solar & Storage Supply Chain Dashboard

Last Update: December 2024
Key U.S. Solar and Energy Storage Manufacturing Stats:
A strong U.S. solar and storage manufacturing base can reduce supply chain uncertainty, drive clean energy deployment, and strengthen America’s energy security.
Federal policies that directly support domestic manufacturing (Section 45X tax credit, Section 48C tax credit), solar deployment incentives (ITC and PTC), and policies that encourage demand for domestic products (domestic content adder credit) have worked in tandem to lead to a boom in U.S. solar and energy storage manufacturing investments. These incentives help make American solar and storage manufacturing more competitive in the global market.
- U.S. solar manufacturing announced investments now total $35.8 billion since federal manufacturing policies were enacted in 2022.
- $4.8 billion of these manufacturing investment announcements are operational, $16.7 billion are under active construction, and another $14.4 billion manufacturing investments are under development.
- These investments will create over 44,000 manufacturing jobs. By 2033, SEIA expects America’s solar manufacturing workforce will grow to 100,000 workers
- These investments will create over 44,000 manufacturing jobs. By 2033, SEIA expects America’s solar manufacturing workforce will grow to 100,000 workers.
- Of these jobs, 8,100 are in facilities that are operational, 18,500 of these jobs are in manufacturing facilities under active construction, and 17,700 of these jobs are in facilities that are under development.
- 67 new solar and storage manufacturing facilities have come online because of federal manufacturing incentives and 48 facilities are under active construction.
- There are solar manufacturing facilities in 43 states and Puerto Rico.
- 225 manufacturing facilities have opened or planning to open in 24 states with Republican Governors and 176 manufacturing facilities have opened or are planning to open in 19 states with Democrat governors.
- 204 manufacturing facilities have opened or planning to open in 103 congressional districts with Republican representatives and 141 have opened or are planning to open in 79 congressional districts with Democrat representatives.
- There is currently 44 gigawatts (GW) of domestic module manufacturing capacity online, enough to supply most of American demand in 2024.
According to the SEIA supply chain dashboard, there have been more than 100 new solar and storage manufacturing announcements since federal manufacturing incentives were established. New manufacturing announcements reflect:
- A stronger manufacturing ecosystem, with increased investment at all levels of the supply chain. This means more key inputs and materials are being processed or manufactured in the United States
- A revival of American solar component manufacturing that has not existed in years.
- An increase in U.S. supplier diversification, with expansions from existing U.S. suppliers and first-time investments by manufacturers new to the American market.
Module Supply Chain
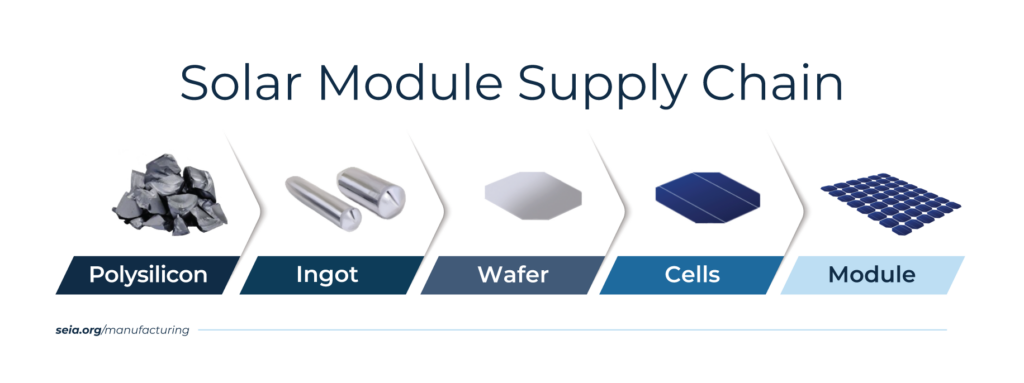
There are two main module technologies that serve the solar market: thin film and crystalline silicon. Thin film module production uses a monolithic manufacturing process where photovoltaic materials are deposited onto substrate such as glass. Crystalline silicon (c-Si or CSPV) module production is a multistep process that includes polysilicon, ingots, wafers, cells, and modules.
The module supply chain includes polysilicon, ingots, wafers, photovoltaic (PV) cells, modules, glass, backsheets, PV wire, encapsulants and more.

In the PV module supply chain, it can take years to build new facilities. The further up the supply chain (further left on the graphic above), the longer the building time, which includes steps like siting, permitting, construction, interconnection and commissioning. This means some of the announced capacity has yet to reach commercial production. New factory openings and more announcements will continue over the next several years.
Since the passage of new manufacturing tax credits, there have been investments to build and expand across the whole solar module supply chain, including ingots, wafers, and cells. Before the federal manufacturing incentives were enacted, there was 41,500 MT/year (approximately 16.6 GW) of polysilicon capacity 7 GW/year of module manufacturing capacity. Polysilicon capacity is expected to come online in the next few years. Suppliers expect the first ingot and wafer facilities to come online by the end of 2024. Cell manufacturing has been onshored for the first time since 2019, and the market expects additional cell manufacturing capacity to come online in 2025. To date, there has been the strongest growth in module manufacturing, growing from 7 GW prior to the federal manufacturing tax credits to 44.4 GW as of December, 2024, which is an increase of over 500%.
Mounting Systems Supply Chain
*The SEIA Supply Chain Dashboard includes racking, torque tubes, and trackers under the racking category.
Solar mounting allows panels to be placed together in solar arrays and creates the main structure for mounting systems onto building roofs or into the ground.
Solar mounting systems provide structural support, electrical bonding and grounding, cable management, spacing, sometimes tracking, and even wind and hail mitigation. Mounting system components being manufactured in the United States include rails, purlins, mounts, spacers, torque tubes, slew drives, linear actuators, wind deflectors, dampers, ballast, rubber gaskets, drills, support beams, and more.
Mounting systems manufacturing facilities have also benefited from the passage of the federal manufacturing tax credits. To date, 26 racking facilities have either announced new facilities or expansions of existing ones. This is a 50% increase in the number of mounting systems manufacturing locations in the United States. American-made solar mounting systems means demand for U.S. steel and aluminum extrusions, demonstrating the secondary impact solar manufacturing can provide to the rest of the manufacturing industry.
Due to the relatively quick time it takes to get a mounting systems facility online (6-12 months), many of the facilities announced in the immediate wake of the federal manufacturing tax credits have already come online. The success of initial investments has spurred new announcements.
The buildout of U.S. mounting systems impacts all market segments. Of the mounting system facilities announced since the passage of federal manufacturing tax credits, 26 of the facilities serve the utility-scale market, 4 facilities also serve the residential market, and another 11 serve the commercial & industrial and community solar markets.
Power Electronics and Grid Technologies Supply Chain
Power electronics and grid technologies help convert the direct current (DC) produced by solar modules to alternating current (AC) used in distribution and most transmission lines. Power electronics manufacturing includes inverters, printed circuit boards (PCBs), combiners, cables, transformers, grain oriented electrical steel (GOES), amorphous steel, large power transformers wires, and similar electrical products.
The federal manufacturing tax credits and incentives for using American manufactured products have made domestically produced inverters more competitive, benefiting both PV and battery energy storage systems (BESS). Since its passage, 18 power electronics suppliers have either announced new facilities or expansions of existing ones. Of the new investments, four will manufacture hybrid inverters (those that serve PV and BESS), two will manufacture microinverters, and one will manufacture string inverters specifically designed for the utility-scale market. Another seven will make electrical balance of systems items (e.g. junction boxes, wires, and combiners) and four will make transformers.
Storage Supply Chain
* SEIA’s Supply Chain Dashboard currently excludes manufacturing facilities designed specifically for electric vehicles, and numbers reflect manufacturing capabilities for residential storage, utility-scale storage, and facilities that serve both the BESS and EV market. While EV-focused facilities are currently excluded, much of the supply chains are the same and contribute to the same domestic manufacturing ecosystem, network effects and economies of scale.
There was limited American storage manufacturing designated to serve the U.S. battery energy storage system (BESS) market prior to the passage of federal manufacturing tax credits. The storage supply chain includes battery materials (anode and cathode materials, and electrolyte), battery cells, and battery packs.
Since the passage of these federal manufacturing tax credits, there has been an expansion in upstream (mining), midstream (processing), and downstream (assembly) battery manufacturing for the BESS and EV markets. SEIA’s supply chain dashboard does not track upstream mining but tracks the midstream processing of anode and cathode materials in the battery materials category and downstream assembly with battery cells and battery packs. Battery cells are individual units that contain the essential components of a battery (anode, cathode and electrolyte), while battery packs are groups of cells connected to meet power and energy needs for a given application.
Battery cell and pack facilities that were announced thanks to federal manufacturing tax credits have begun to come online. Additional cell and pack capacity expected online over the next few years, as downstream battery manufacturing takes years to come online. Midstream processing for anode and cathode materials are expected to begin operations by 2025, with an announced 650,000 metric tons of battery materials targeting to be online by the end of the decade.
Solar & Storage Manufacturing Investments and Job Creation
The federal manufacturing tax credits have resulted in billions of dollars in solar and storage manufacturing investment. These investments help grow the economy, support communities, and provide thousands of good paying jobs for Americans. U.S. solar and storage manufacturing investments have more than doubled, with over $35 billion announced investments.
Manufacturing jobs at announced facilities have also doubled since the manufacturing tax credits were codified. If each of these facilities come online, there will be over 40,000 solar manufacturing jobs by the end of the decade.
Tracking the Buildout of the U.S. Solar Supply Chain
With this map, you can filter by product type and facility status, as well as create a drive-time radius from any map point to explore geographic distances to potential customers or suppliers.
To view this map in fullscreen mode, click here.
You can also submit information regarding additions or corrections to the data on this map using this form. The data is available on the Sphere for SEIA members at or above the Kilowatt level. To learn more about SEIA membership, click here.
Disclaimers
This product reflects only the publicly available data underpinning SEIA’s Solar and Storage Supply Chain dashboard. As a result, there may be some differences between the data in this file and aggregate data published on the SEIA website which may include non-public information. The data is collected from press releases, news articles, member submissions, and other sources. Additionally, facilities that SEIA has determined to be unlikely to move forward have been removed from the public data sheet.
We provide this data and map as-is and do not guarantee its accuracy or completeness. It is meant for informational purposes only. The user of the data assumes the entire risk associated with its use of these data. SEIA shall not be held liable for any use or misuse of the data described and/or contained herein. The user of the data bears all responsibility in determining whether these data are fit for its intended use.
Please cite this resource as “SEIA Solar and Storage Supply Chain Dashboard.” If you would like to provide additional information or corrections, please use this submission form. For other questions, email supplychain@seia.org.


