
1. Key figures
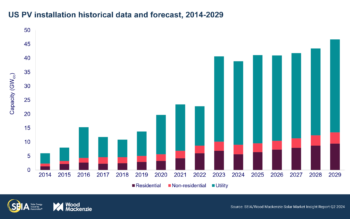
- In Q2 2024, the US solar market installed 9.4 GWdc of capacity, a record second quarter for the industry. While installations declined 21% quarter-over-quarter, they increased 29% from a year earlier.
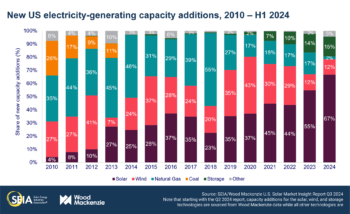
- Solar accounted for 67% of all new electricity-generating capacity added to the US grid in the first half of 2024.
- Domestic module manufacturing capacity increased by over 10 GW to 31.3 GW in Q2 2024 as more facilities continued to come online.
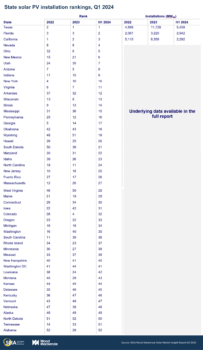
- Texas was the leading state for solar installations in the first half of the year, with 5.5 GWdc online – nearly twice as much capacity as Florida, the second-ranked state, which had 2.9 GWdc.
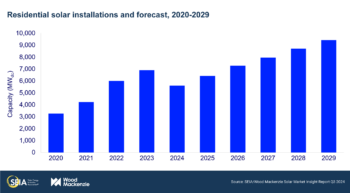
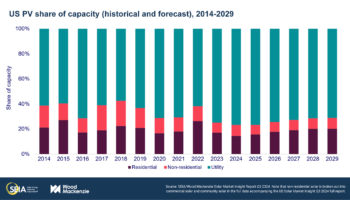
- The residential segment continued to decline, with 1.1 GWdc installed in Q2, a decrease of 10% quarter-over-quarter and 37% year-over-year. California continued to drive this decline, shrinking 36% from the first quarter during the state’s transition to net billing. We expect residential solar installations to hit a floor this year, driving a 19% contraction in residential solar nationwide.
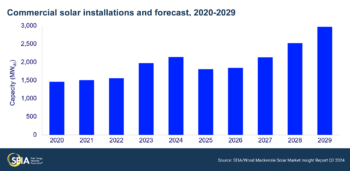
- The commercial solar segment installed 427 MWdc in Q2 2024, 5% less than Q1 2024 and 6% more than Q2 2023.
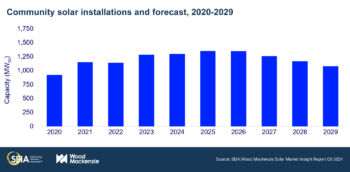
- The community solar segment installed 270 MWdc in Q2 2024, a decline of 12% both quarter-over-quarter and year-over-year. A handful of states saw quarter-over-quarter growth, but this was outweighed by declines in key markets like Maine, Massachusetts, and Illinois.
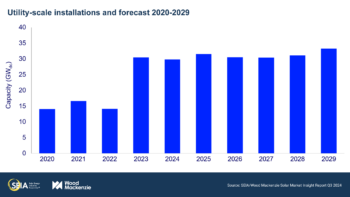
- The utility-scale segment installed 7.6 GWdc, a robust 59% increase year-over-year. While this reflects a 23% decline from Q1 2024, first quarter volumes were high due to projects finally coming online after various delays throughout 2023.
- In this report, we have incorporated our estimated impacts of potential new antidumping and countervailing duties (AD/CVD) on imports of crystalline silicon cells and modules from four Southeast Asian countries. Preliminary determinations for these tariffs are anticipated this fall. While there is still considerable uncertainty around final details, we expect that tariff impacts on solar deployment will be modest. There is sufficient cell and module production capacity from multiple sources that isn’t subject to the proposed tariffs: production located outside of the target countries, expanding domestic production, and sources of thin film modules.
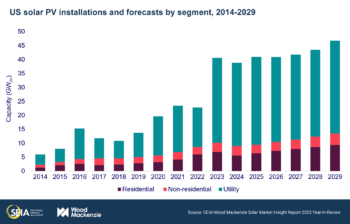
- Our latest five-year outlooks show the US solar industry will consistently install at least 40 GWdc per year from 2025 onward. This year, installations are expected to decline 4%, driven by a 2% decline in the utility-scale segment and a 19% decline in the residential segment. From 2025-2029, annual growth will average 4% for the entire industry. Utility-scale solar – the largest segment – continues to be limited by a lack of labor availability, high voltage equipment constraints, and interconnection delays.
2. Introduction
The US solar industry installed 9.4 gigawatts-direct current (GWdc) of capacity in the second quarter of 2024, the largest Q2 capacity addition in US history. While installations declined 21% quarter-over-quarter, they increased 29% from a year earlier.
This growth was mostly driven by the utility-scale segment. By contrast, installation volumes across the distributed solar segments were weak. Residential solar shrank by 37% year-over-year, driven strongly by California’s transition to net billing and sustained high interest rates. With 427 MWdc installed, commercial solar declined 5% year-over-year but increased 6% from the first quarter. Several major state markets like California, Illinois, and New Jersey were relatively flat. Community solar declined 12% both year-over-year and quarter-over-quarter with 270 MWdc installed. A handful of states saw quarter-over-quarter growth, but this was outweighed by declines in key markets like Maine, Massachusetts, and Illinois. There is pending legislation to establish new community solar programs in several states, but progress has been slow. Finally, utility-scale solar had a healthy quarter, growing 59% year-over-year with 7.6 GWdc installed. The project pipeline is strong, but impediments to project execution continue to suppress growth.
Overall, photovoltaic (PV) solar accounted for 67% of all new electricity-generating capacity additions in the first half of 2024, making solar the dominant form of new generating capacity in the US.
Expectations for 2024 remain on track with some slight downgrades
Our expectations for 2024 solar installations are just 2% lower than they were last quarter – 38.9 GWdc compared to last quarter’s 39.7 GWdc. Every market segment has been downgraded slightly for various reasons.
We now expect residential solar to shrink 19% this year compared to our previous expectation of a 14% decline. Second quarter volumes were less than expected, driven strongly by only 230 MWdc of residential installations in California, the lowest quarter since 2020. But most states saw quarterly declines – sustained high interest rates combined with retail rate declines in some states continue to temper consumers’ appetite for residential solar.
Several factors have driven the downgrade in our expectations for residential solar this year. Installers and sales companies report lackluster sales volumes in the last several months. Typically, Q1 is the slowest quarter for residential solar, and sales activity picks up in the spring and continues to grow throughout the year. After a slow first quarter, installers hoped their volumes would recover in the spring and early summer, but this hasn’t been the case. Furthermore, major bankruptcies (Titan Solar and SunPower) will contribute to lower installation volumes in the near term. These factors have driven the downgrade in our expectations for residential solar – we expect 5.6 GWdc of installations compared to last year’s 6.9 GWdc.
Commercial solar is expected to grow 8% this year and community solar is expected to be flat compared to 2023. Our outlooks for these segments have been reduced slightly to account for modest second quarter installations. California installed a decent volume of commercial solar projects as the backlog of NEM 2.0 projects continued to interconnect. But other key states were either flat or down in the second quarter.
Utility-scale solar installations are forecast to reach 29.8 GWdc this year, a 2% decline from 2023. As mentioned previously, the segment had a healthy second quarter. But we have heard of some projects getting delayed to 2025 due to lengthening lead times for critical electrical equipment and limited labor availability from EPC firms. Consequently, our outlook for 2025 has increased by more than 2 GW to 31.5 GWdc.
We estimate that potential new AD/CVD tariffs would only modestly impact our solar outlooks
We’ve been monitoring the potential impacts of the latest antidumping and countervailing duties (AD/CVD) since they were proposed by a group of US solar manufacturers in April 2024. These petitions were filed with the US Department of Commerce (DOC) and the US International Trade Commission (USITC) seeking new AD/CVD tariffs on imports of crystalline silicon solar cells and modules from Cambodia, Malaysia, Thailand, and Vietnam (CMTV). If enacted, tariffs would also apply to imports of modules produced outside the targeted countries with cells produced in those countries.
The deadlines for the preliminary determinations have been postponed – the deadline for the CVD preliminary determination is now September 27 and the deadline for the AD determination is now November 27. The petitioners have also filed a request for a finding of critical circumstances in the Thailand and Vietnam investigations, which could result in collection of duties retroactive to 90 days prior to the date of publication of the preliminary determinations.
There is considerable uncertainty surrounding these potential tariffs. It will be some time before the industry knows whether the tariffs will be enacted, and if they are, at what tariff levels for various companies and countries. However, the prospect of tariffs has already impacted the industry. Given the questions surrounding these potential tariffs, we have incorporated their impact into our solar outlooks with some assumptions.
We expect negligible impacts on the utility-scale segment for a few reasons. First, there is a substantial amount of module inventory (including both crystalline silicon and non-subject thin film) already allocated to current projects – we’ve tracked 35 GW as of the end of the first quarter (see our insight piece “Navigating turbulence in the US solar supply chain” for more details). Many of these projects have already begun construction. This inventory is expected to supply projects through the end of this year and potentially for part of next year.
Second, the global solar supply chain has expanded considerably in the last two years. Major suppliers are either shifting their cell and module supply chains outside of the targeted countries or have already done so. Developers either have access to previously imported inventory, domestic sources, and non-subject thin film supply, or will be importing equipment from outside the targeted countries. Developers report that their projects would remain on track, and thus, our utility-scale forecasts are not impacted by potential new tariffs.
We expect some modest near-term impacts on the distributed solar segments. About 40% of projects in the residential segment and 60% in the commercial and community segments import modules from these countries. And while there is also an inventory of modules for the distributed solar segments, shorter project timelines mean equipment isn’t procured as far in advance, and the impacts of tariffs could be more immediate. We project that the tariffs would result in a 4% reduction in residential installations, a 5% reduction in commercial installations, and a 4% reduction in community solar installations in 2025 compared to our forecast without the new tariffs. However, shorter project timelines also provide flexibility to adapt supply chains quickly. These impacts will steadily ease and eventually become negligible over the coming years as installers and distributors procure non-tariffed equipment.
The final impacts of any new AD/CVD tariffs are still uncertain, in part because modules and cells subject to last year’s finalized anticircumvention AD/CVD tariffs are outside the scope of these new tariffs. It is also worth noting that these prospective tariffs could strain some domestic module manufacturers that planned on importing cells from the impacted countries. Wood Mackenzie will continue to monitor and track the situation.
The US solar industry remains the foundation of the energy transition, but more support is needed
From 2024 through 2029, the US solar industry is on track to install over 250 GWdc of capacity. Annual growth will average 4% from 2025 onward, with some segments growing faster than others. The solar industry continues to be the leading technology of the energy transition. But the solar industry continues to face challenges and uncertainty, such as navigating continued shortages of critical electrical equipment, the outcomes of the AD/CVD preliminary determinations, and the political environment. These developments, amongst others, will influence the solar industry’s growth trajectory. More support will be needed to accelerate growth beyond our forecast and achieve carbon emissions reduction goals.
3. Market segment outlooks
3.1. Residential PV
- 1,132 MWdc in Q2 2024
- Down 37% from Q2 2023
- Down 10% from Q1 2024
The residential solar market’s downturn continued into the second quarter
The residential solar market is off to its slowest start since 2021. In Q2 2024, the segment added 1,132 MWdc, a decline of 37% year-over-year and 10% quarter-over-quarter. In the first half of 2024, only seven states experienced year-over-year growth in installed capacity. Residential solar sales and installations were weaker than expected in the last quarter, contributing to more pessimism for this year’s outlook. As financing rates remain high, demand has yet to follow the typical upward trajectory that occurs in the spring and summer. These factors forced many installers to lay off staff and exit unprofitable markets last quarter. Some companies have not been able to survive this downturn; two major residential solar market players have announced bankruptcies in the past three months.
As a result of these trends, the residential solar market’s outlook for 2024 was reduced by 5% this quarter. Based on low installed capacity in the first half of the year, a weaker seasonal uptick in sales, some major installer exits, and fewer interest rate cuts than expected, Wood Mackenzie now expects a 19% year-over-year reduction in residential installations in 2024. California volumes are expected to drop by 41% compared to 2023. California made up over 30% of residential solar capacity additions in 2023 and the state contributes significantly to our expectations of a national contraction. We now expect an 8% decline in residential installations for all states other than California in 2024.
We do expect a residential solar market recovery in 2025, with continued growth through the remainder of our five-year outlook. However, we expect that the potential new Southeast Asian AD/CVD tariffs will impact this growth, which reduces our 2025-2029 outlook by 2%. There is a greater impact in the near term as domestic and alternative sources of supply have not fully ramped up to meet demand. The residential solar market will still grow by 14% in 2025, fueled by momentum in the third-party ownership segment and qualification for the ITC bonus adders, especially domestic content. In the long term, the market will add over 33 GWdc between 2026 and 2029 as growth in emerging markets picks up and retail electricity rates increase.
3.2. Commercial PV
- 427 MWdc installed in Q2 2024
- Up 6% from Q2 2023
- Down 5% from Q1 2024
Note on market segmentation: Commercial solar encompasses distributed solar projects with commercial, industrial, agricultural, school, government, or nonprofit offtakers, including remotely net-metered projects. This excludes community solar (covered in the following section).
California’s NEM 2.0 projects contribute to quarter of single-digit growth for commercial solar
Commercial solar installations increased 6% year-over-year in Q2 2024, resulting in 877 MWdc of new installations through the first half of this year – a 4% increase compared to the first half of 2023. Second-quarter growth for commercial solar was driven mainly by solid installation volumes in California and Illinois, totaling 230 MWdc of installed capacity between the two states. More mature states such as New Jersey and New York had strong quarters, despite their pipelines declining over the past few quarters. On the other hand, states like Maine, Texas, and Georgia struggled last quarter with low installation volumes. Developers are continuously exploring nontraditional markets as commercial solar growth slows in legacy markets and new market opportunities emerge. In emerging commercial solar markets, developers can benefit from lower costs, better land availability, and increasing energy prices.
Market uncertainty has increased for commercial solar developers as they navigate the likelihood of receiving the domestic content adder and the looming possibility of new AD/CVD tariffs. To combat this, developers are spending an increasing amount of time on creating strategies to stabilize processes and minimize contract risk.
As a result of low installations across many states so far this year, our 2024 outlook for commercial solar decreased by 3% compared to last quarter. Even though we incorporated the new AD/CVD tariffs into our forecast, our expectations for 8% average annual growth from 2024 to 2029 remain unchanged. We expect the tariffs to impact the commercial market more significantly in the near term, resulting in a 4% reduction in our forecast for 2025 compared to our prior outlook. We now expect a 15% contraction in the national commercial solar market in 2025, fueled mainly by the California net billing transition. In the long term, growth will gradually increase due to the benefits of the IRA and the continued rise of electricity rates. We expect 2,138 MWdc of new national capacity additions to come online this year, which will grow to nearly 3 GWdc in 2029.
3.3. Community solar PV
- 270 MWdc installed in Q2 2024
- Down 12% from Q2 2023
- Down 12% from Q1 2024
Note on market segmentation: Community solar projects are part of formal programs where multiple residential and non-residential customers can subscribe to the power produced by a local solar project and receive credits on their utility bills.
The top three community solar state markets made up 73% of total interconnected capacity in H1 2024
Community solar installations declined 12% year-over-year in Q2 2024, resulting in the lowest quarter of installed capacity since Q3 2022. Massachusetts and Maine had particularly slow quarters, with Q2 2024 capacity volumes declining 95% and 52% year-over-year, respectively. There were 577 MWdc of installations in the first half of the year, a 2% decline compared to H1 2023. As expected, mature state markets made up most of this total – New York, Maine, and Illinois accounted for a staggering 73% of total installed community solar capacity. At the same time, momentum has been building more slowly than expected in emerging state markets. In Delaware and New Mexico, interconnection delays have pushed the first wave of projects to the end of this year at the earliest. Overall, H1 2024 totals align with our expectation of 1% annual growth in 2024, with total annual capacity forecast to reach 1.3 GWdc.
As mature state markets saturate, community solar growth hinges on the success of emerging programs and the successful implementation of federal funding. Program pipelines in mature states like New York and Illinois remain strong, supporting near-term growth. However, these markets cannot continue to sustain growth long-term, and emerging state markets are not growing fast enough to make up the difference. Additionally, what could have been a banner year for community solar legislation has instead transformed into a year of disappointments, highlighting the difficulty of getting new community solar programs enacted and off the ground. On the bright side, stakeholders anticipate the $7 billion Solar for All funding from the Environmental Protection Agency will have a positive impact on national community solar growth once implementation plans are finalized by the end of this year.
Overall, we expect the national community solar market to grow at an average annual rate of 2% through 2026 and then contract by 7% on average through 2029. Importantly, our five-year outlook includes only state markets with programs currently in place and does not include states with proposed program legislation, leaving upside potential of an increased national forecast if new legislation is passed. Additionally, this forecast incorporates the impacts of the potential new AD/CVD tariffs. Anticipated impacts from these tariffs resulted in a 4% reduction to our five-year outlook compared to last quarter.
3.4. Utility PV
- 5 GWdc installed in Q2 2024
- Up 59% from Q2 2023
- Over 186 GWdc of utility-scale solar will be added between 2024 and 2029
Utility-scale segment hits another quarterly record with 7.5 GWdc installed
The utility-scale sector achieved its strongest second quarter on record, with 7.5 GWdc of capacity installed in Q2 2024. This represents 59% year-over-year growth. At the same time, 7.7 GWdc of new utility-scale projects were contracted in Q2 2024, representing a 23% year-over-year decline. As installations matched procurement activity this quarter, the total contracted pipeline remained at 96 GWdc.
Wood Mackenzie forecasts that over 186 GWdc of new utility-scale solar will come online between 2024-2029, reflecting a 1% increase compared to our previous forecast. The 2.4 GWdc increase to the outlook is concentrated in 2025, driven by projects that started construction in Q2 2024. These projects were originally expected to come online in 2024 but will be delayed into 2025 due to a few factors. First, developers are taking longer than expected to secure EPC firms due to constrained availability as well as more complex contract negotiations. Second, there continue to be long lead times for procuring transformers and high-voltage circuit breakers.
The new Southeast Asian AD/CVD investigation is expected to have negligible impacts on the forecast due to existing module inventory, increasing domestic production, diversification in sources of module supply, and continued availability of thin-film modules that are not subject to the investigations. Strong demand in the utility scale sector maintains an average annual buildout of 31 GWdc over our five-year outlook. However, utility-scale solar continues to be limited by a lack of labor availability, constraints on the supply of high-voltage equipment, and interconnection delays.
4. US solar PV forecasts
5. National solar PV system pricing
- Residential system pricing is down 6% year-over-year
- Commercial system pricing is down 12% year-over-year
- Utility-scale system pricing is down 2% for fixed-tilt and 1% for single-axis tracking year-over-year
Wood Mackenzie employs a bottom-up modeling methodology to capture, track and report national average PV system pricing by segment for systems installed each quarter. The methodology is based on the tracked wholesale pricing of major solar components and data collected from industry interviews. Wood Mackenzie’s Supply Chain data and models are leveraged to enhance and bolster our pricing outlooks. Wood Mackenzie assumes all product is procured and delivered in the same year as the installation except modules for the utility segment, which are procured one year prior to commercial operation.
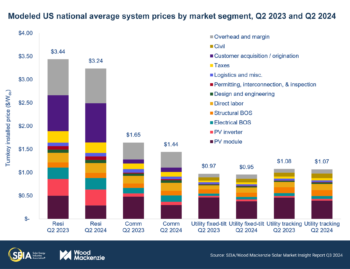
PV system pricing declined across all market segments in Q2 2024. Despite increased balance of system (BOS) and labor costs, these were outweighed by module price declines. Module costs for the distributed generation segment decreased by an average of 40% year-over-year, resulting in a 6% and 12% decline in residential PV system costs and commercial PV system costs, respectively, in Q2 2024. As demand in the distributed segment remains sluggish due to elevated interest rates, the supply imbalance for modules continues to put downward pressure on module costs.
For the first time in over two years, the utility segment also experienced a decline in total system costs. The segment continues to face long equipment lead times and labor shortages. The balance of plant cost is also up as equipment and labor have become more expensive due to inflation. Despite these challenges, overall costs for the fixed-tilt and single-axis tracking systems were down 2% and 1%, respectively, in Q2 2024. The price drop can be attributed to a 16% year-over-year decline in the average module price for the segment driven by a module supply/demand imbalance and decreases in raw material costs.
License
Ownership rights
This report (“Report”) and all Solar Market Insight® (“SMI”)TM reports are jointly owned by Wood Mackenzie and the SEIA® (jointly, “Owners”) and are protected by United States copyright and trademark laws and international copyright/intellectual property laws under applicable treaties and/or conventions. Purchaser of Report or other person obtaining a copy legally (“User”) agrees not to export Report into a country that does not have copyright/intellectual property laws that will protect rights of Owners therein.
Grant of license rights
Owners hereby grant user a non-exclusive, non-refundable, non-transferable Enterprise License, which allows you to (i) distribute the report within your organization across multiple locations to its representatives, employees or agents who are authorized by the organization to view the report in support of the organization’s internal business purposes, and (ii) display the report within your organization’s privately hosted internal intranet in support of your organization’s internal business purposes. Your right to distribute the report under an Enterprise License allows distribution among multiple locations or facilities to Authorized Users within your organization.
Owners retain exclusive and sole ownership of this report. User agrees not to permit any unauthorized use, reproduction, distribution, publication or electronic transmission of any report or the information/forecasts therein without the express written permission of Owners.
Disclaimer of warranty and liability
Owners have used their best efforts in collecting and preparing each report.
Owners, their employees, affiliates, agents, and licensors do not warrant the accuracy, completeness, correctness, non-infringement, merchantability, or fitness for a particular purpose of any reports covered by this agreement. Owners, their employees, affiliates, agents, or licensors shall not be liable to user or any third party for losses or injury caused in whole or part by our negligence or contingencies beyond Owners’ control in compiling, preparing or disseminating any report or for any decision made or action taken by user or any third party in reliance on such information or for any consequential, special, indirect or similar damages, even if Owners were advised of the possibility of the same. User agrees that the liability of Owners, their employees, affiliates, agents and licensors, if any, arising out of any kind of legal claim (whether in contract, tort or otherwise) in connection with its goods/services under this agreement shall not exceed the amount you paid to Owners for use of the report in question.

