
1. Key figures
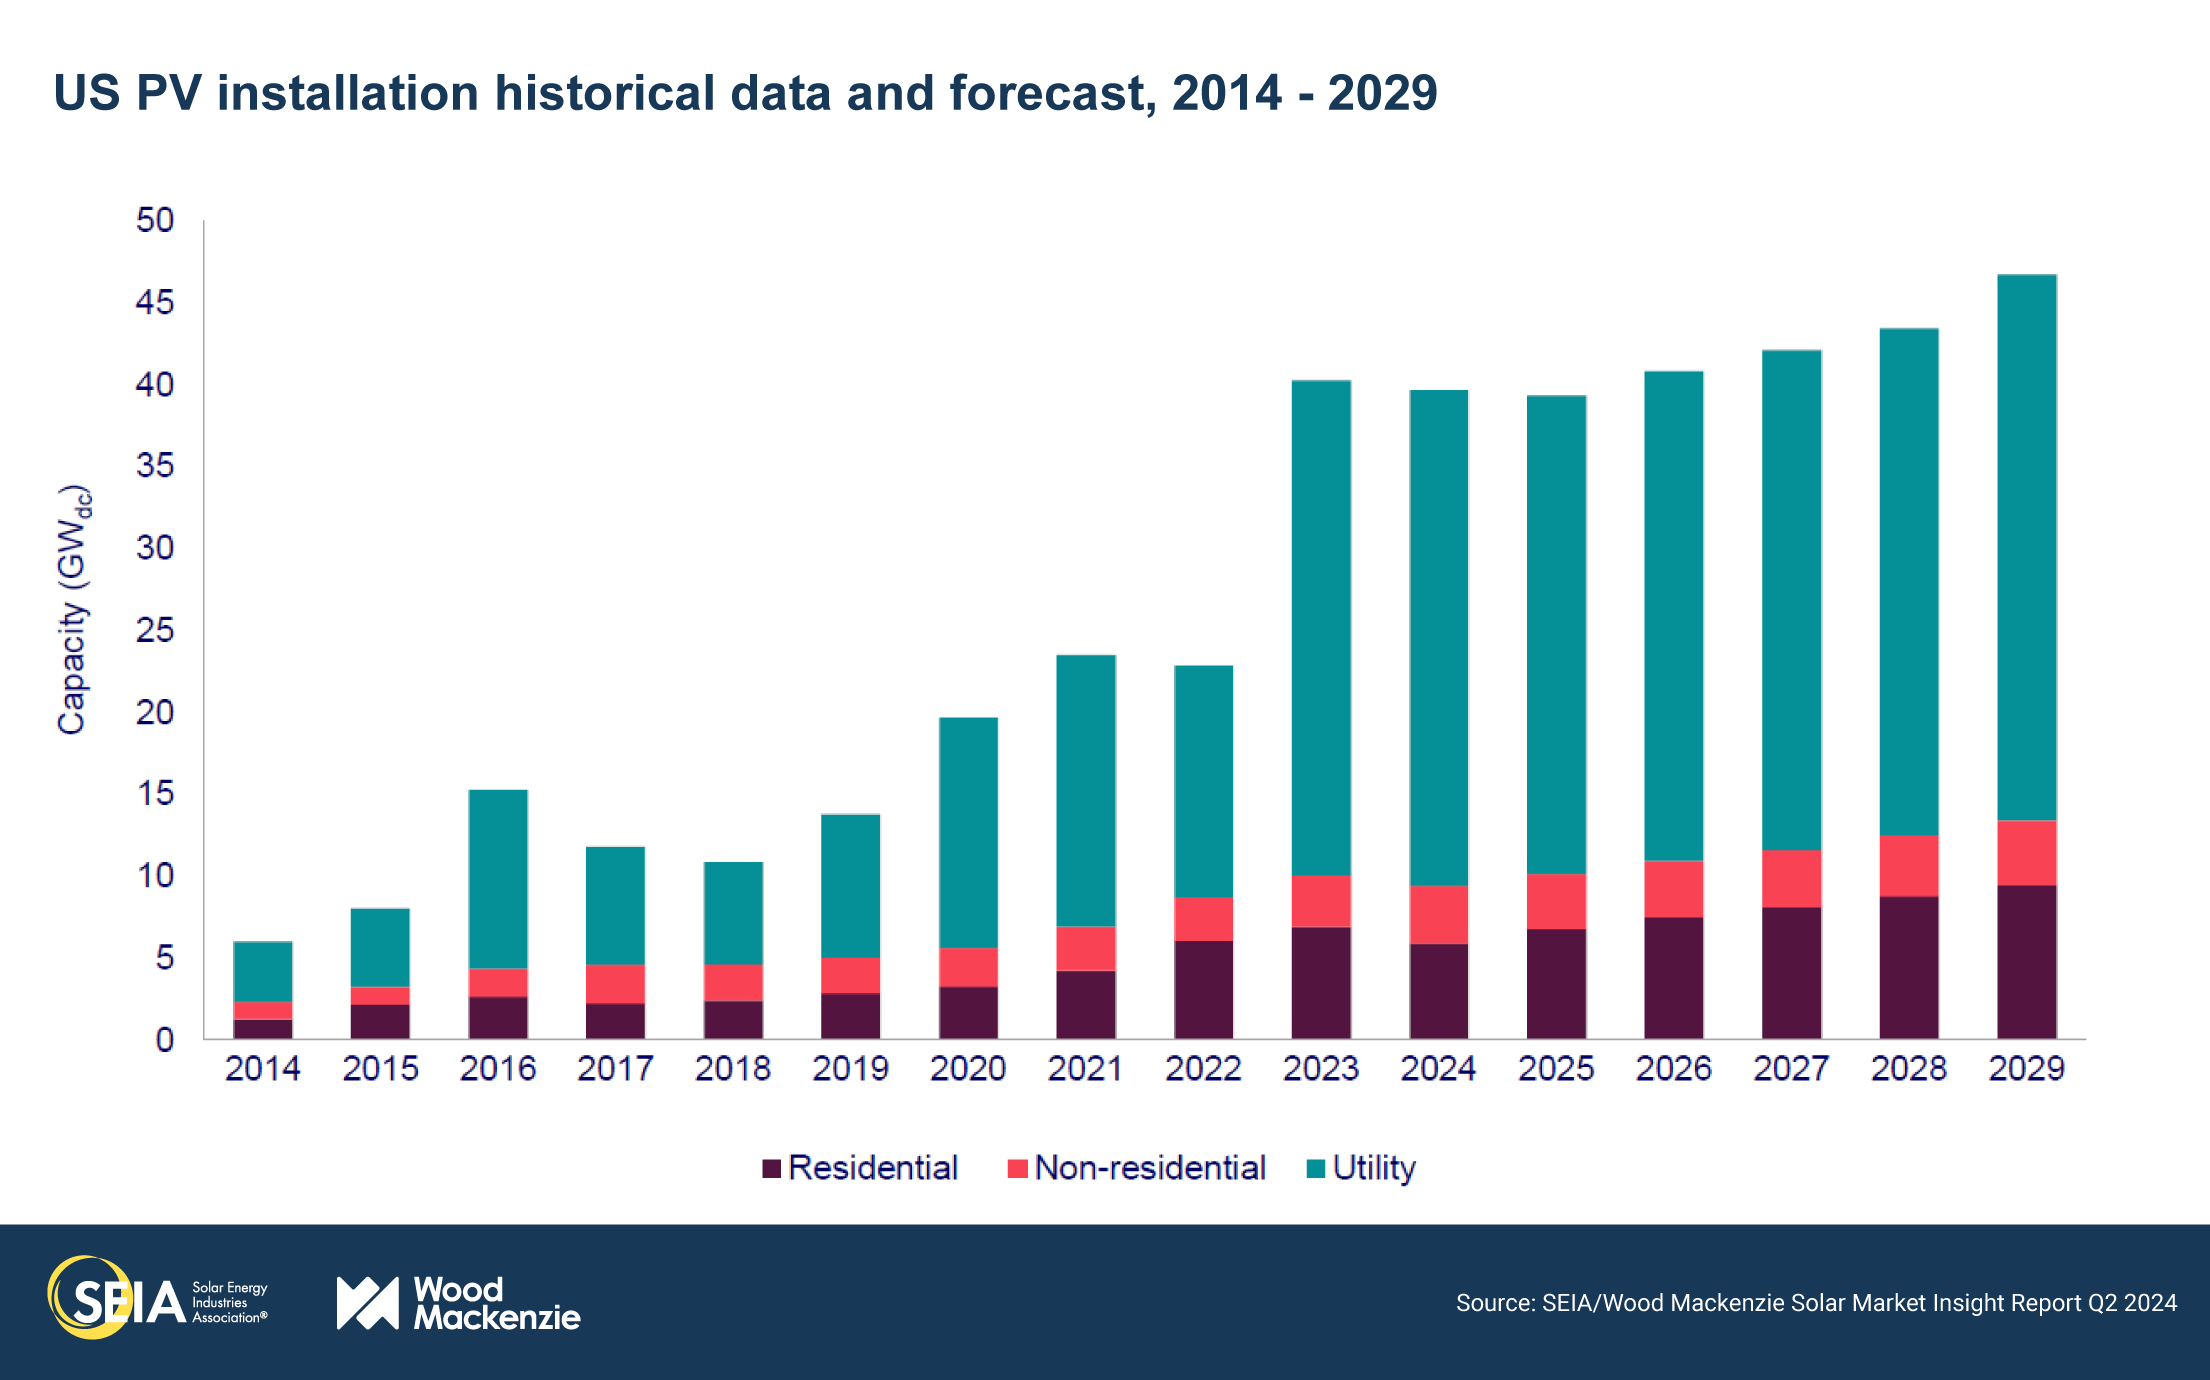
- In Q1 2024, the US solar market installed 11.8 GWdc of capacity, a record first quarter for the industry. It was the industry’s second-largest quarter of installations in history, second only to the previous quarter, Q4 2023.
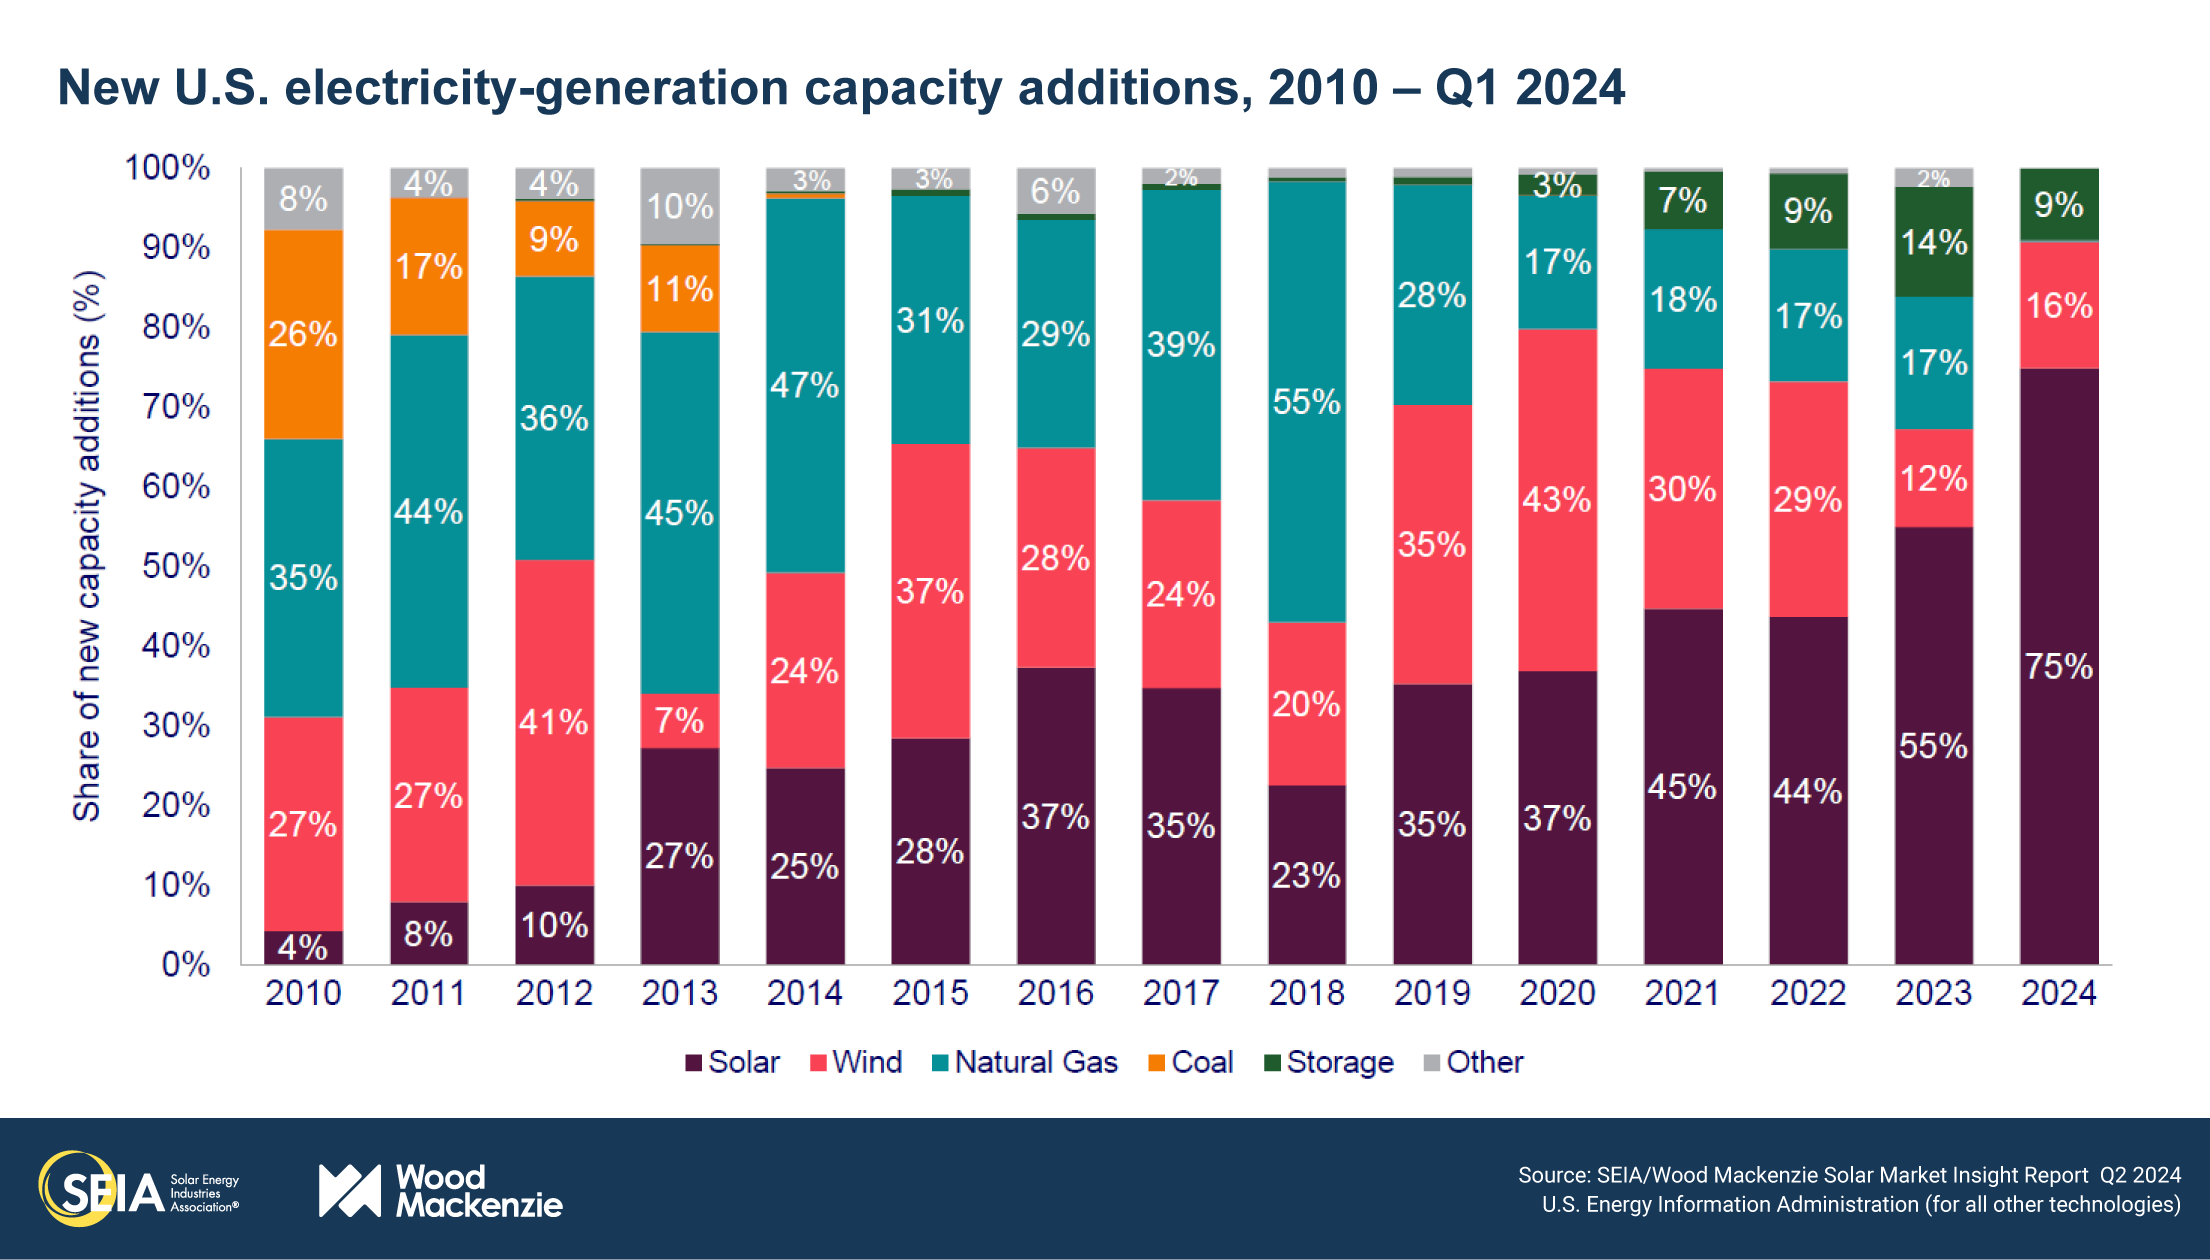
- Solar accounted for 75% of all new electricity-generating capacity added to the US grid in the first quarter of 2024.
- Domestic module manufacturing capacity increased to 26.6 GW in Q1 2024 compared to 15.6 GW in Q4 2023. Once this capacity fully ramps up, it will be sufficient to supply about 70% of domestic demand.
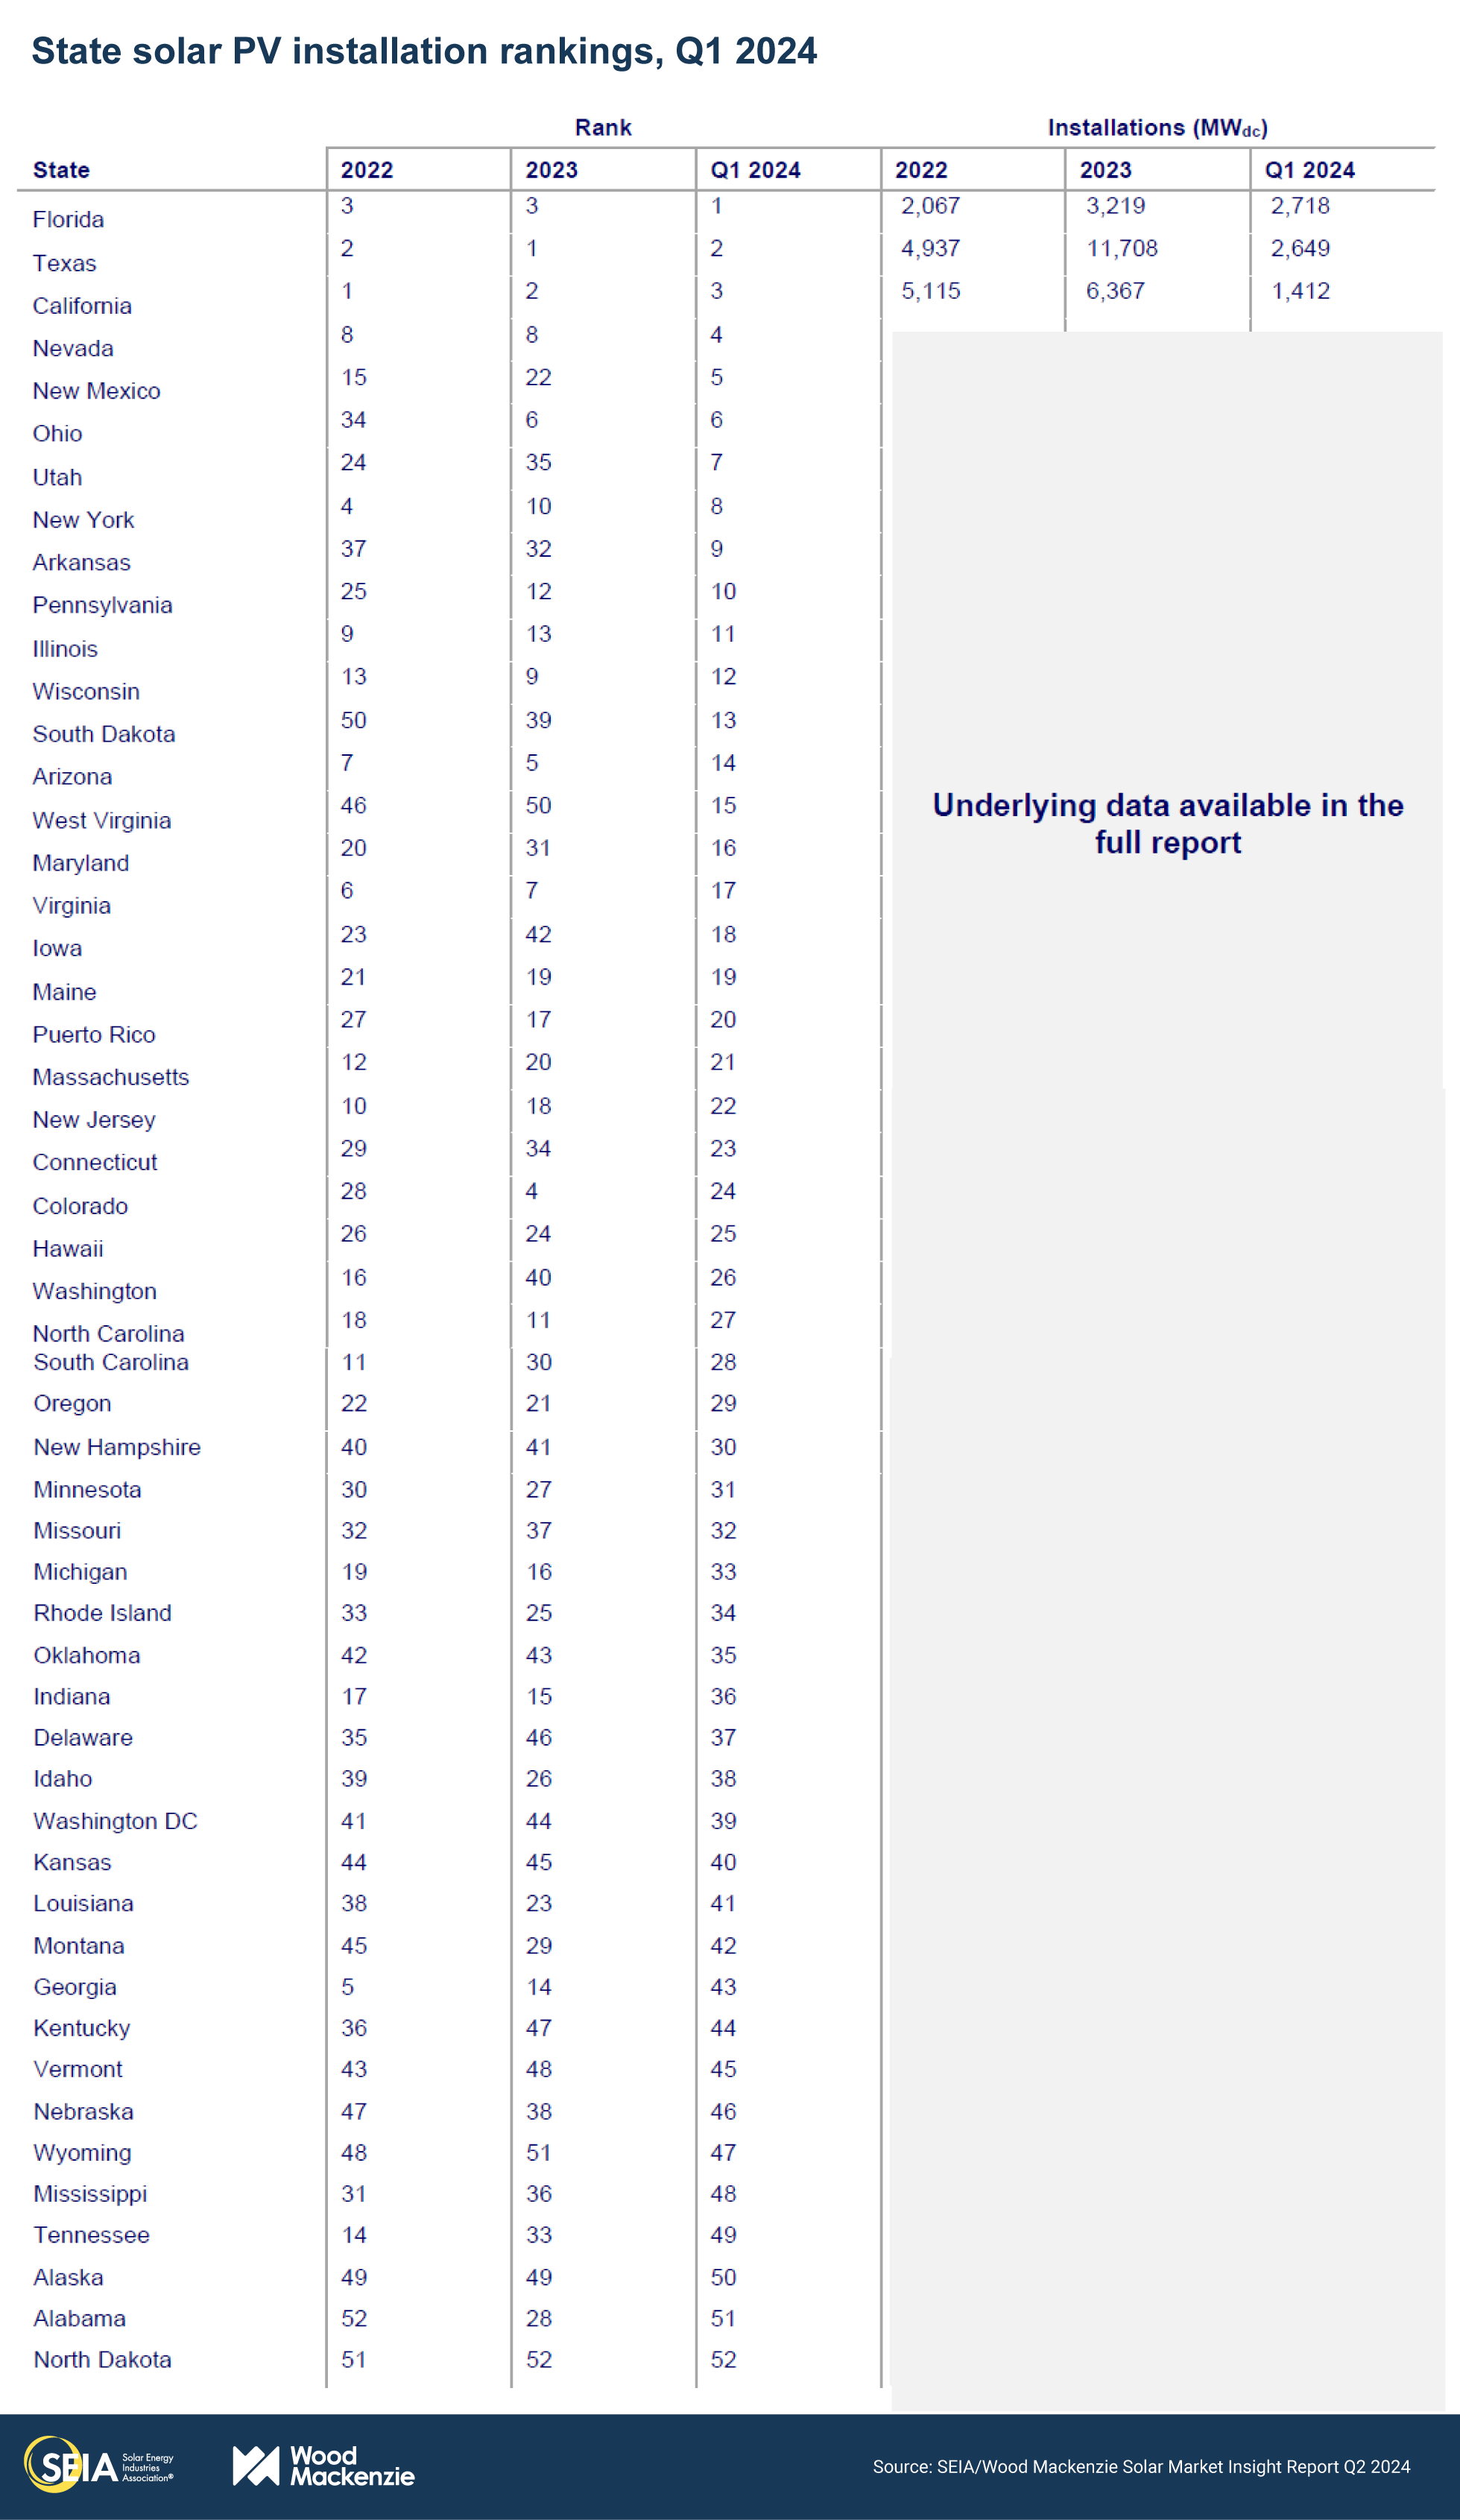
- Florida installed the most solar in the first quarter of the year (2.7 GWdc), with Texas as a close second (2.6 GWdc). For both states, the vast majority of these installations were utility-scale.
- The residential segment had its lowest quarter since Q1 2022 at 1.3 GWdc, reflecting a 25% decline year-over-year and 18% quarter-over-quarter. While slowdowns are occurring nationwide, these declines were heavily influenced by California, where quarterly installations have shrunk for the last two quarters as NEM 2.0 projects are built out and the state transitions to the net billing tariff.
- The commercial solar segment installed 434 MWdc in Q1 2024, roughly equal to Q1 2023, and a 38% decline from Q4 2023. The commercial solar market is diversifying – newer, smaller markets are growing while mature ones are shrinking.
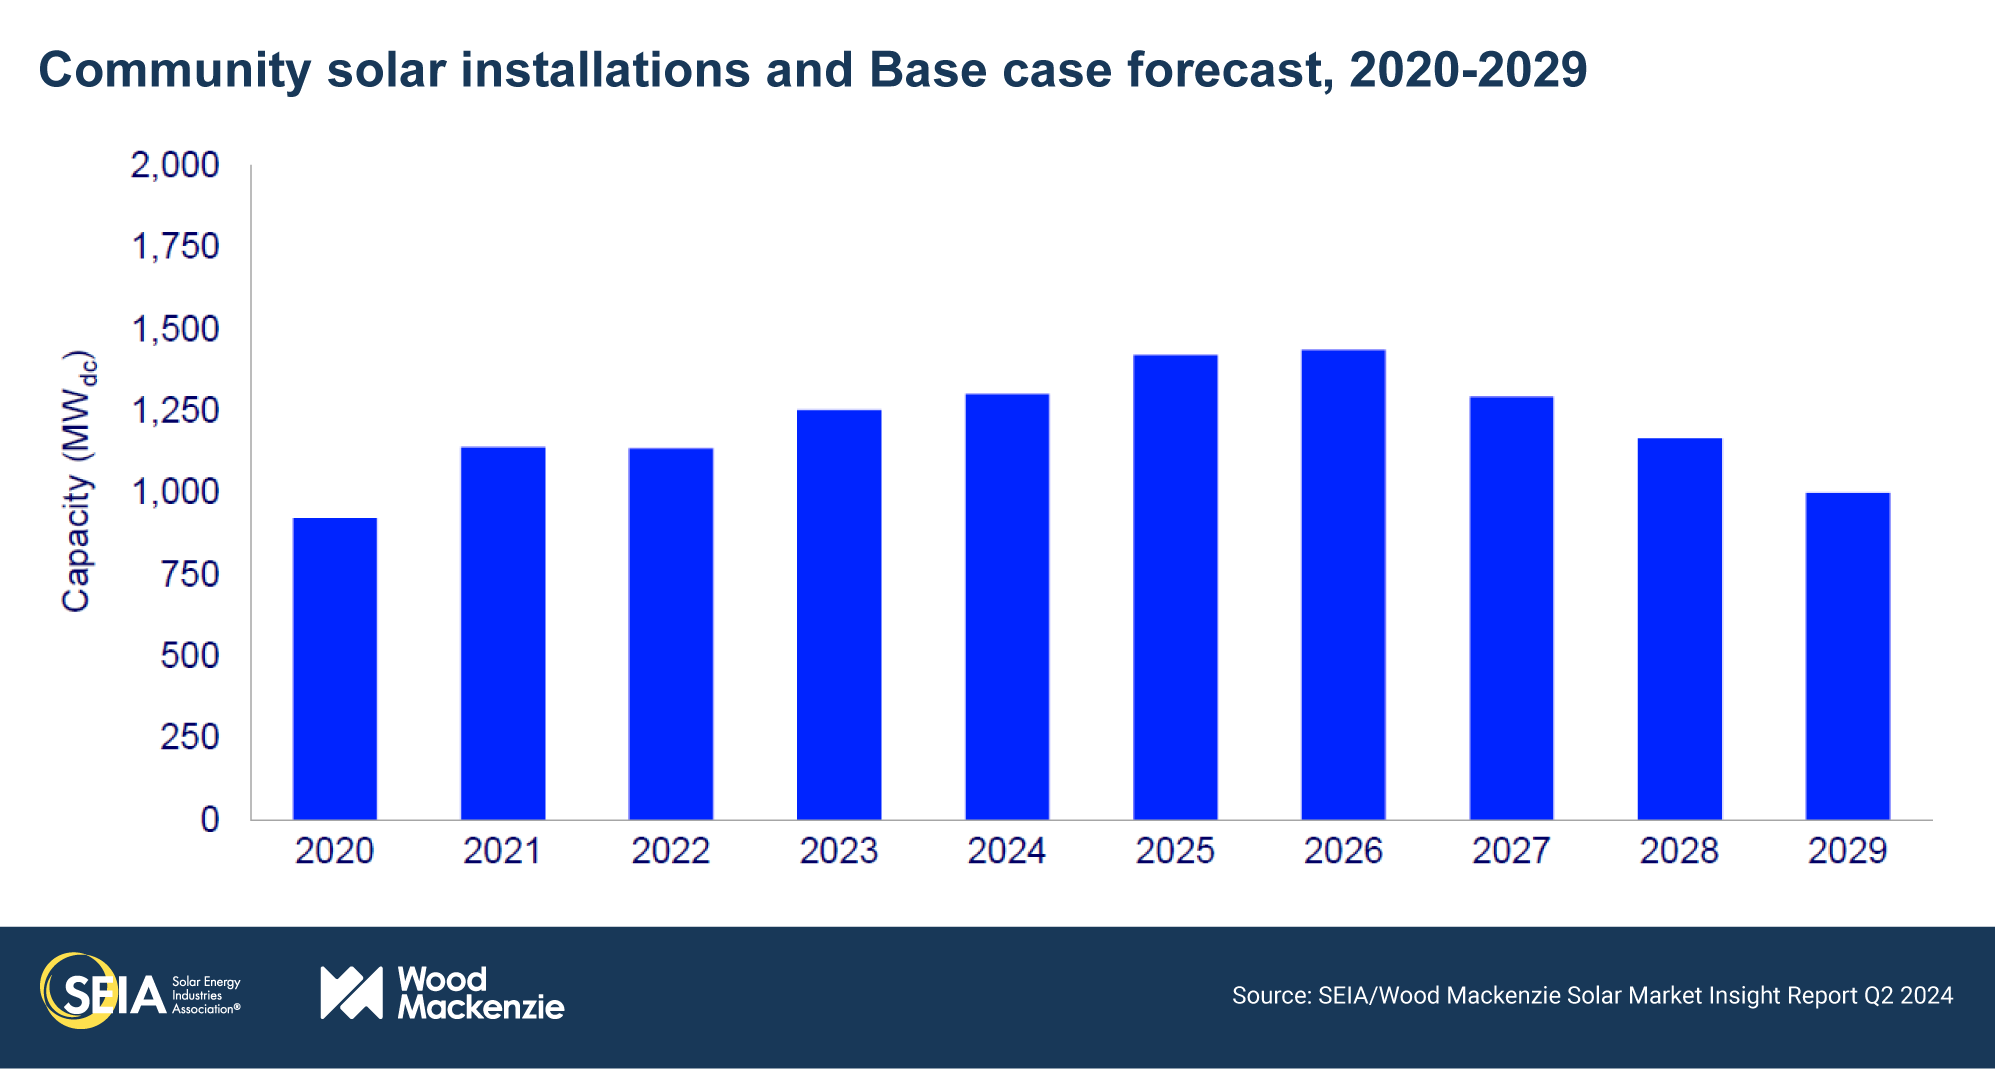
- The community solar segment installed 279 MWdc in Q1 2024, also equal to the same quarter last year, and a 32% decline from Q4 2023. This industry segment awaits enabling policy to expand into new state markets.
- The utility-scale segment continues to have record-breaking quarterly installation volumes, with 9.8 GWdc installed in Q1 2024. This was the largest first quarter ever for utility-scale deployment, more than double the volume of any previous first quarter. Capacity additions in Florida, Texas, California, and Nevada contributed heavily to the strong quarter. Projects that have faced various delays are coming online.
- Over the last few months, the solar industry has been contending with numerous policy changes, including tariffs on imports of solar cells and modules. In this report, we’ve accounted for the updates to the Section 201 tariffs, notably the removal of the bifacial module exemption. And while the Section 301 tariffs were doubled (from 25% to 50%) for Chinese solar cells and modules, the tariff increase will not have a significant direct impact on the US solar industry, given the low volume (less than 0.1%) of Chinese imports.
- This report does not yet incorporate the impacts of potential new antidumping and countervailing duties (AD/CVD) on imports of crystalline silicon cells and modules from four Southeast Asia countries. It is still early days for these cases, with the timeline and tariff levels for any potential new tariffs still highly uncertain. But it’s important to note that there is sufficient cell and module production capacity outside the target countries to serve the US market, along with domestic production and thin film production.
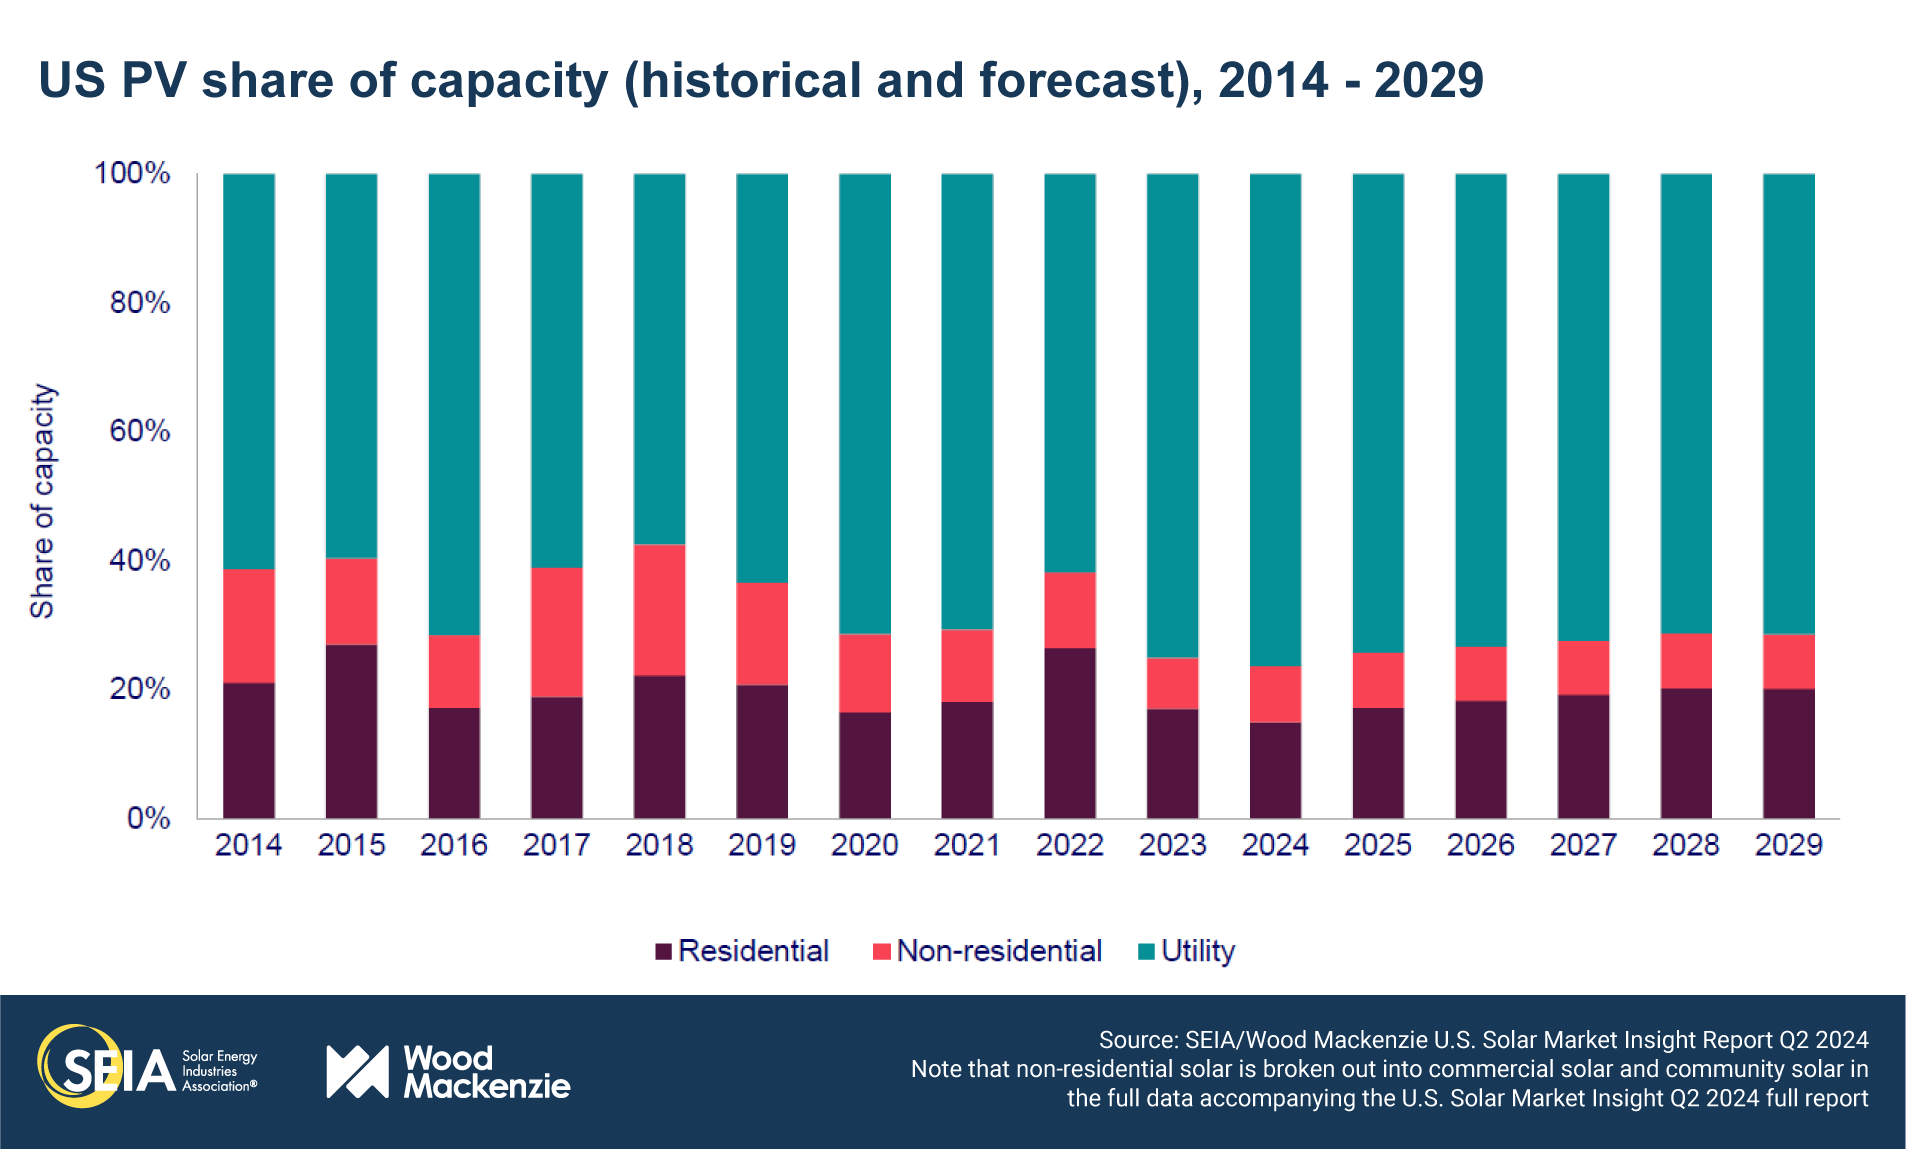
- Our latest five-year outlooks show the US solar industry will consistently install around 40 GWdc a year for the next five years. In 2024 and 2025, growth will be flat, driven mostly by a slowdown in growth for utility-scale solar. Lack of labor availability, high voltage equipment constraints, and continued trade policy uncertainty impede continued growth. From 2026-2029, annual growth will average single digits as the various segments balance each other out. In this timeframe, residential solar will grow by 9% and commercial solar will grow by 11% on average. By contrast, community solar will shrink by 8% and utility-scale solar will only grow by 3% on average.
2. Introduction
The US solar industry installed 11.8 gigawatts-direct current (GWdc) of capacity in the first quarter of 2024, the second-best quarter for the industry, behind the last quarter of 2023. The utility-scale segment had a remarkable quarter, putting 9.8 GWdc of projects in the ground – more than the annual total for this segment as recently as 2019.
The distributed solar segments did not perform as strongly. Residential solar shrank by 25% year-over-year as the segment continued to struggle with high interest rates and the transition to net billing in California. With 1.3 GWdc installed, it was the segment’s lowest quarter since Q1 2022. The commercial and community sectors were relatively flat year-over-year, installing 434 MWdc and 279 MWdc, respectively. The commercial sector is diversifying – newer states are growing but are offset by declines in mature markets. Community solar relies heavily on the creation of new state programs and policies to generate growth in new markets. While there’s been progress on legislation in several states, new policies have been slow to cross the finish line. Furthermore, the promise of future market growth in California withered away with the March decision by the California Public Service Commission (CPUC) to reject a proposed new program (more on this in the full report).
Overall, photovoltaic (PV) solar accounted for 75% of all new electricity-generating capacity additions in the first quarter of 2024, remaining the dominant form of new generating capacity in the US.
2024 installation growth will be mixed across the various solar segments
After achieving record growth in 2023, the solar industry is expected to install about the same amount of capacity in 2024 -just under 40 GWdc. While growth this year is expected to be flat, this still represents an annual installation volume that is double the size of just two years ago. Our expectations for 2024 reflect mixed trends across segments.
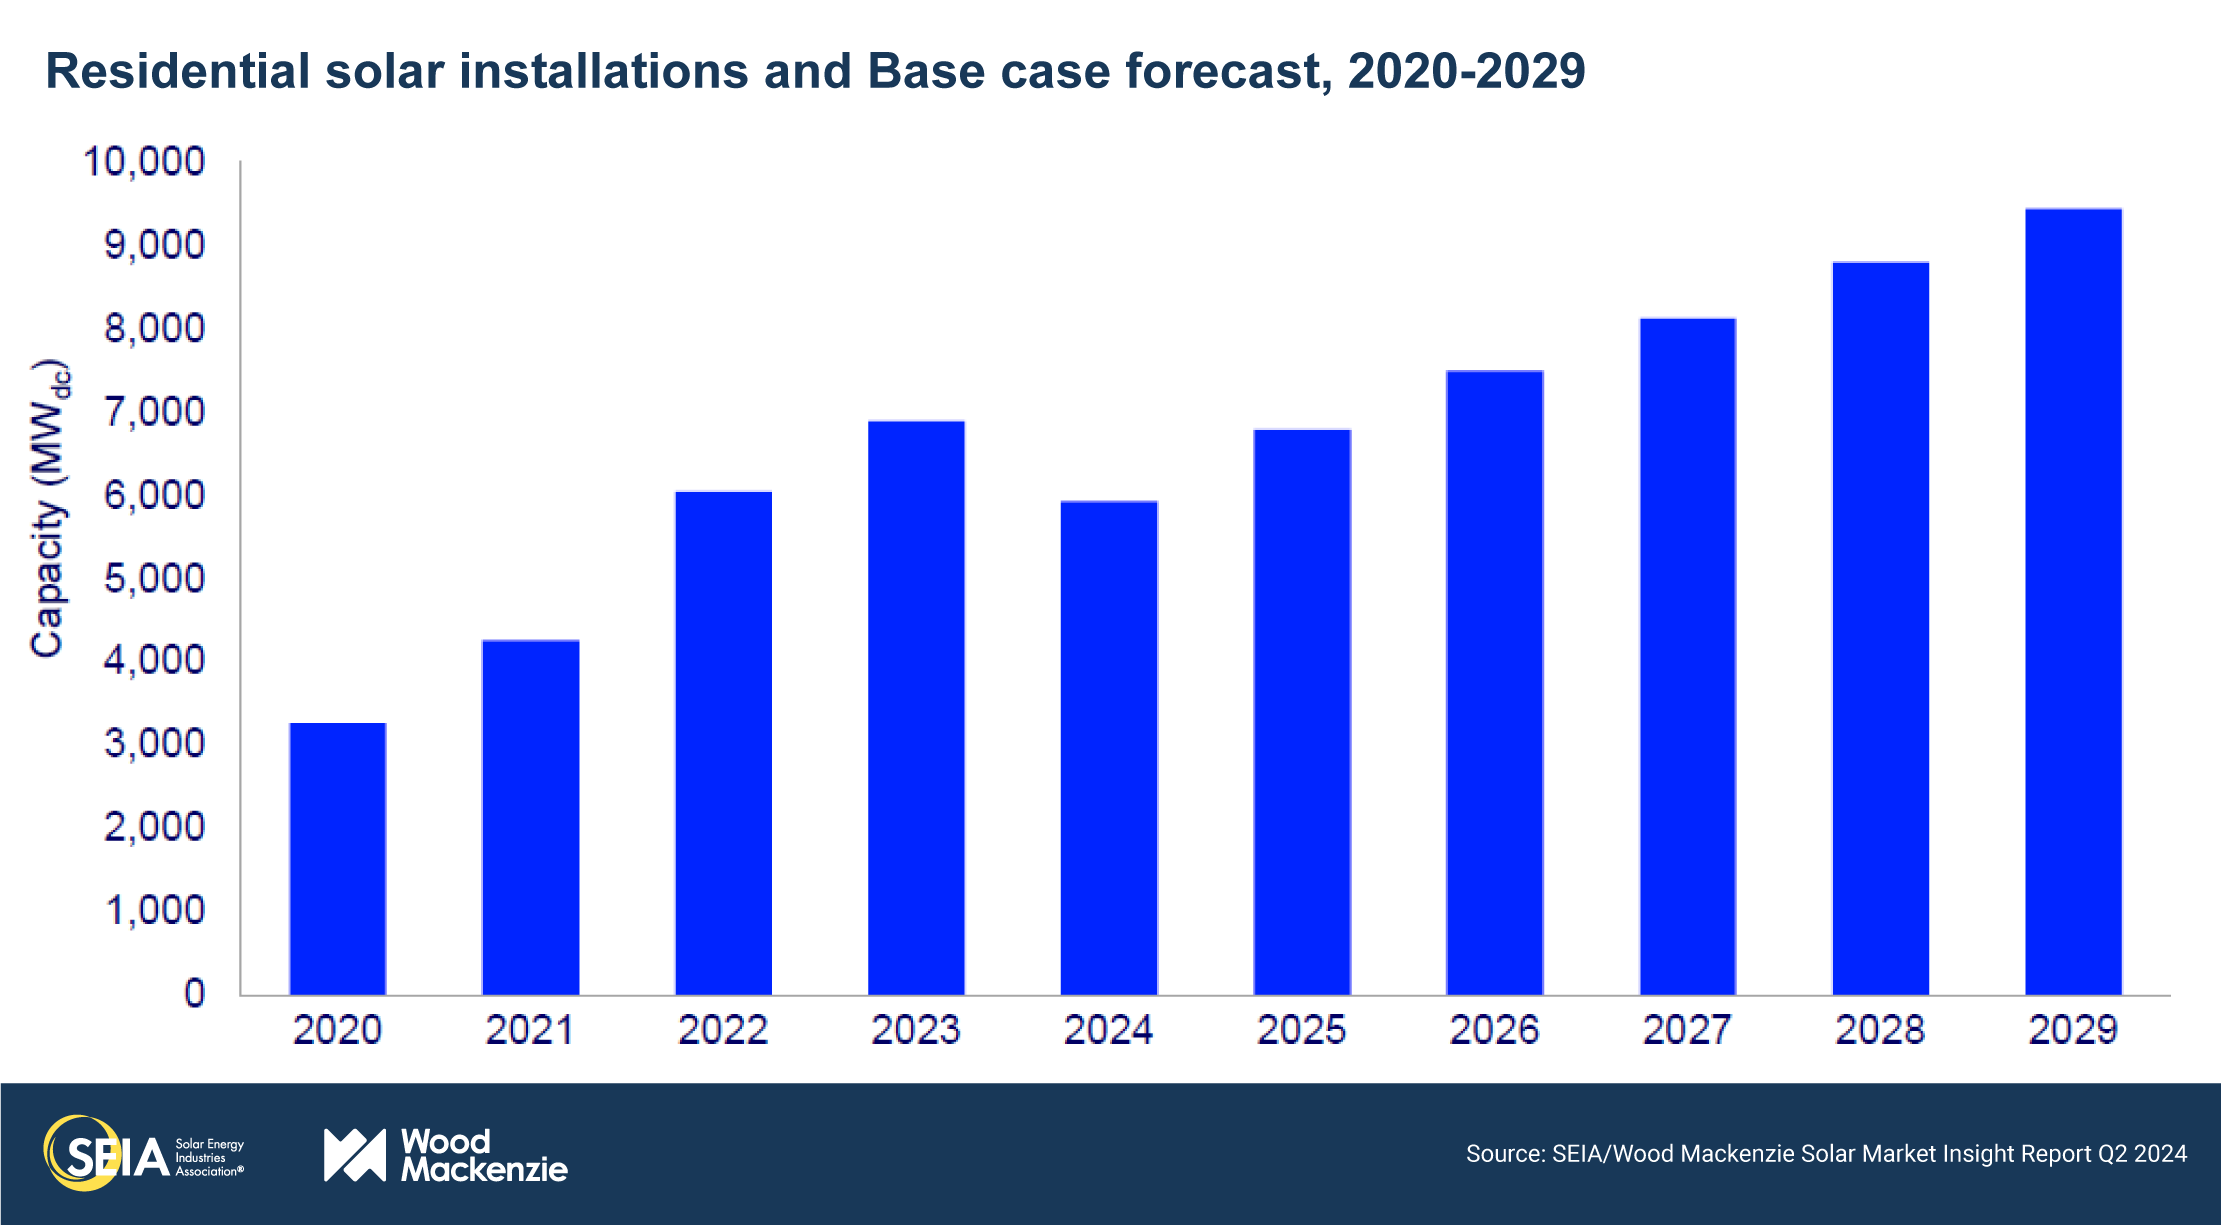
Residential solar is expected to shrink 14% year-over-year. California residential volumes will decline by about 40%, as we’ve predicted since the net billing tariff was finalized. Solar-plus-storage installations are on the rise (see the full report for more details), but this doesn’t compensate for the declines in standalone solar. Overall residential sector growth outside of California is expected to be flat. Higher interest rates are still challenging residential solar sales since they increase financing costs for homeowners.
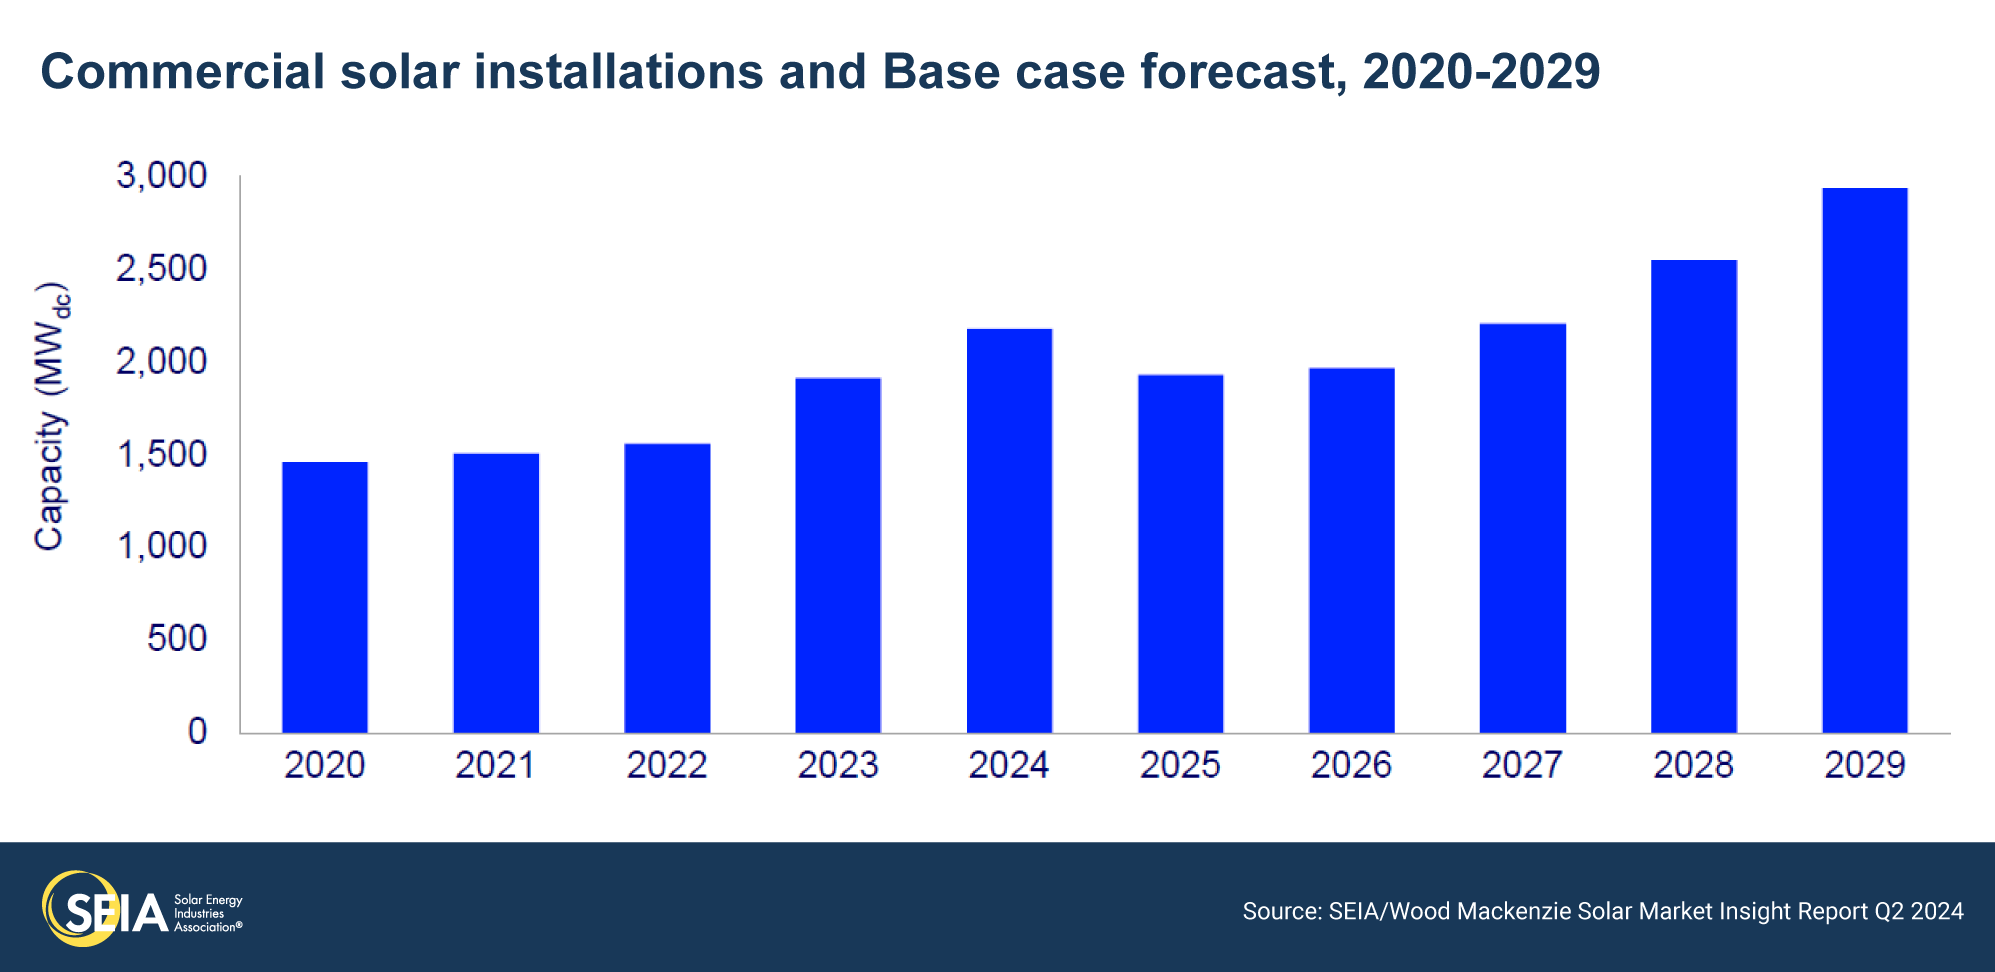
After 23% growth in 2023, commercial solar is expected to grow by another 14% this year. This is primarily driven by growth in two states – California and Illinois. In California, projects that submitted interconnection applications under NEM 2.0 will still be coming online this year due to typical 18–36-month development timelines for these projects. And in Illinois, pipelines that have qualified under the Illinois Shines program are being built out in earnest.
Community solar is expected to grow by 4% after growing 10% last year. Some states, such as Illinois and Virginia, are seeing growth. But as noted earlier, other states have been slow to form new programs and growth is slowing in more mature markets.
Utility-scale solar growth will remain flat in 2024 and 2025. The pipeline is strong, but buildout is being suppressed by a lack of labor availability, high voltage equipment constraints, and continued trade policy uncertainty, amongst other headwinds.
Modest growth for US solar through 2029 points to broader energy transition challenges
From 2024-2029, the US solar industry will install more than 250 GWdc of capacity, roughly 40 GWdc a year. While this is certainly proof of the solar industry’s strong standing in the energy transition, it also represents a slowdown of industry growth. The growth patterns vary amongst segments, but average annual growth between now and 2029 is 3%.
Solar projects across all segments are facing challenges that go beyond technological viability, cost competitiveness, or module availability. The limiting factors for projects today span the power industry: availability of labor, interconnection delays and costly network upgrades, high soft costs and interest rates, opposition to new project development, and more. These are not exclusively solar industry challenges. They are some of the toughest challenges of the energy transition. A higher growth trajectory for the US solar industry hinges on the extent to which these challenges can be solved.

3. Market segment outlooks
3.1. Residential PV
- 1,281 MWdc in Q1 2024
- Down 25% from Q1 2023
- Down 18% from Q4 2023
The residential solar market recorded its lowest quarter of installed capacity in two years
The challenges from 2023 continued to plague the residential solar industry in the first quarter of 2024. These include high interest rates, the transition to a net billing tariff in California, and increasing customer acquisition costs. This has led to a two-year low in quarterly installed capacity. In Q1 2024, the segment added 1,281 MWdc, a 25% year-over-year and 18% quarter-over-quarter decline. While a first-quarter installation slowdown is typical for residential solar, some industry players report a more pronounced slowdown than in past years as high interest rates persist. The drop in installed capacity in California contributed to the national decline this quarter, as installations from sales made under NEM 2.0 dwindled.
In the first quarter of 2024, 28 states experienced both quarter-over-quarter and year-over-year declines in installed capacity due to the ripple effects of sustained high financing costs. Notably, installed residential capacity in Texas fell for the fifth consecutive quarter in Q1, as the top installers in the state experienced more than 60% reductions in installation volumes compared to Q1 2023. Many installers reported using creative ways to maintain revenue, like serving solar co-op programs or diversifying their offerings to include system servicing, storage retrofits, and roof replacements.
Low first-quarter volumes are in line with our expectations of a residential solar market contraction this year as macroeconomic headwinds continue and installations in California fall by nearly 40% compared to 2023. Some states will still grow this year, fueled by lower module prices, a rapidly growing third-party ownership segment, and significant retail rate increases. However, interest rates remain high, and it is unclear when they may begin to decline. This contributes to our expectations of a 2% contraction for all states other than California, with a 14% reduction in installations at the national level. But looking ahead, we expect recovery starting in 2025, with the residential solar market growing by 10% on average over the next five years, as retail rates trend upwards, increasing potential savings for residential customers.
3.2. Commercial PV
- 434 MWdc installed in Q1 2024
- Down 38% from Q4 2023
- Down 1% from Q1 2023
Note on market segmentation: Commercial solar encompasses distributed solar projects with commercial, industrial, agricultural, school, government, or nonprofit offtakers, including remotely net-metered projects. This excludes community solar (covered in the following section).
Consistent installations in traditional commercial solar markets continue to drive national stability
Installations in the commercial solar segment were flat year-over-year in the first quarter, supported by solid installation volumes in mature markets such as California, Illinois, and New York. In California, 152 MWdc of commercial solar capacity was installed in Q1 as NEM 2.0 projects continued to come online. This contributed to our expectations for 27% annual growth for the state. As the Illinois Shines program continued to attract developers in the near term, Illinois experienced a significant 212% increase year-over-year, with 61 MWdc installed in Q1 2024. New York also had a strong quarter of installations, driven by its more efficient interconnection processes compared to other states.
Even though we expect growth this year, developers in many states continue to face frustrating challenges with interconnection timelines. Due to these interconnection issues, growing market saturation, and high development costs in established markets, developers are increasingly shifting focus to emerging commercial solar markets. In some nascent commercial solar markets (even those without formal net metering policies), developers can benefit from lower costs and ample available sites. Rising energy demand and retail rate increases are also attracting developers to these markets.
The commercial solar outlook remains mostly unchanged since last quarter. As an influx of California NEM 2.0 projects come online through the end of this year, we expect 14% year-over-year growth. However, national installations will decline in 2025 due to an expected drop in California installations as the NEM 2.0 pipeline gets built out and mature markets become more saturated. Prevailing wage and apprenticeship requirements will also contribute to a decline in 2025. Since new projects larger than 1 MWac must meet these requirements to qualify for the full tax credits, developers likely began construction on a significant portion of their active pipeline before requirements took effect in January 2023. Much of this pipeline will have been built by 2025, resulting in slightly reduced volumes from 2025 through 2027. In the longer term, the national commercial solar market will grow by 15% annually in both 2028 and 2029. Increased development activity in newer commercial solar markets, particularly in the Midwest and Southeast, will heavily contribute to this growth. ITC adder qualification and rising electricity prices will also drive national long-term growth, averaging 8% over the next five years.
3.3. Community solar PV
- 279 MWdc installed in Q1 2024
- Up 1% from Q1 2023
- Down 32% from Q4 2023
Note on market segmentation: Community solar projects are part of formal programs where multiple residential and non-residential customers can subscribe to the power produced by a local solar project and receive credits on their utility bills.
The proposed decision on California community solar suppresses long-term national market growth
Community solar installations remained relatively flat year-over-year in Q1 2024, resulting in 279 MWdc of new capacity. Installed capacity in New York grew 17% year-over-year in Q1 2024, making up 46% of national installed capacity. Additionally, while first-quarter growth in Illinois, Colorado, and Virginia supported national installations, other state markets are off to a slow start. Overall, we expect the national market to grow 4% in 2024, exceeding 1.3 GWdc of annual capacity. Mature state markets will drive most of this year’s capacity, but we also anticipate momentum will build in newer markets such as Delaware and Virginia.
We’ve made significant downward adjustments to our five-year forecast due to the recent policy updates in California. In March 2024, the CPUC issued a proposed decision on A.B. 2316, siding with utility arguments and against the widely backed Net Value Billing Tariff (NVBT) proposal. As a result, our five-year outlook for California decreased from more than 1.5 GWdc to just over 200 MWdc, an 87% decline. The massive market potential of the NVBT program proposal was anticipated to bolster long-term national market growth. However, the CPUC voted to confirm a slightly modified proposed decision on May 30th, resulting in a 14% reduction in our 2024-2028 outlook compared to last quarter.
Overall, we expect the national community solar market to grow at an average rate of 5% annually through 2026 and then contract by 11% on average through 2029. Importantly, our five-year outlook includes only state markets with programs currently in place and does not include states with proposed program legislation. Additionally, we continue to monitor the impact of Solar for All funding, awards for which were announced in April. Several state agencies in both existing and potential state markets proposed using funds for community solar and bill savings for community solar subscribers, potentially supporting new development and long-term growth.
3.4. Utility PV
- 9.8 GWdc installed in Q1 2024
- Up 135% from Q1 2023
- 184 GWdc of utility-scale solar will be added between 2024 and 2029
Utility-scale segment achieved a record first quarter, with 9.8 GWdc installed
The utility-scale sector achieved its strongest first quarter on record, with 9.8 GWdc of capacity installed in Q1 2024, growing 135% year-over-year. Additionally, newly contracted projects in Q1 2024 reached 4.4 GWdc, with corporate and utility procurement as the main drivers for newly contracted capacity. Although procurement activity has continued, installations have outpaced its growth, reducing the contracted pipeline by 5 percent, to 96 GWdc.
The substantial increase in first quarter installations was driven by a backlog of projects that were slated to come online in 2023 but did not materialize until Q1 2024. Additionally, President Biden’s two-year tariff waiver on imported Southeast Asian crystalline silicon modules ends in June 2024. The temporary waiver has contributed to increased imports and higher module inventory levels. However, modules imported under the waiver that are subject to the circumvention tariffs must be “utilized” within 180 days of the expiration of the waiver (by December 3, 2024). This has driven increased installation activity at the start of the year.
Wood Mackenzie forecasts that 184 GWdc of new utility-scale solar will come online between 2024-2029, reflecting a 1% increase compared to our previous forecast. The 3.1 GWdc increase is mainly driven by high installation volumes in Q1 2024. Utility procurements, corporate clean energy goals, and state-mandated targets continue driving strong demand in the utility-scale sector, maintaining an average annual buildout of 30 GWdc. Despite strong installation growth compared to Q1 2023, the availability of labor and high-voltage equipment will continue to limit buildout through 2025. Continued issues with permitting and interconnection will also restrict utility-scale installations, maintaining the relatively flat buildout throughout the rest of the forecast period.
4. US solar PV forecasts
5. National solar PV system pricing
- Residential system pricing is down 4% year-over-year
- Commercial system pricing is down 12% year-over-year
- Utility-scale system pricing is up 5% for fixed-tilt and 4% for single-axis tracking year-over-year
Note: In November 2023, Wood Mackenzie published a refreshed customer acquisition cost analysis (US distributed solar customer acquisition cost outlook 2023). Therefore, there are changes to the modeled residential customer acquisition costs and overall national average turnkey pricing in this report compared to past quarters.
Wood Mackenzie employs a bottom-up modeling methodology to capture, track and report national average PV system pricing by segment for systems installed each quarter. The methodology is based on the tracked wholesale pricing of major solar components and data collected from industry interviews. Wood Mackenzie’s Supply Chain data and models are leveraged to enhance and bolster our pricing outlooks. Wood Mackenzie assumes all product is procured and delivered in the same year as the installation except modules for the utility segment, which are procured one year prior to commercial operation.
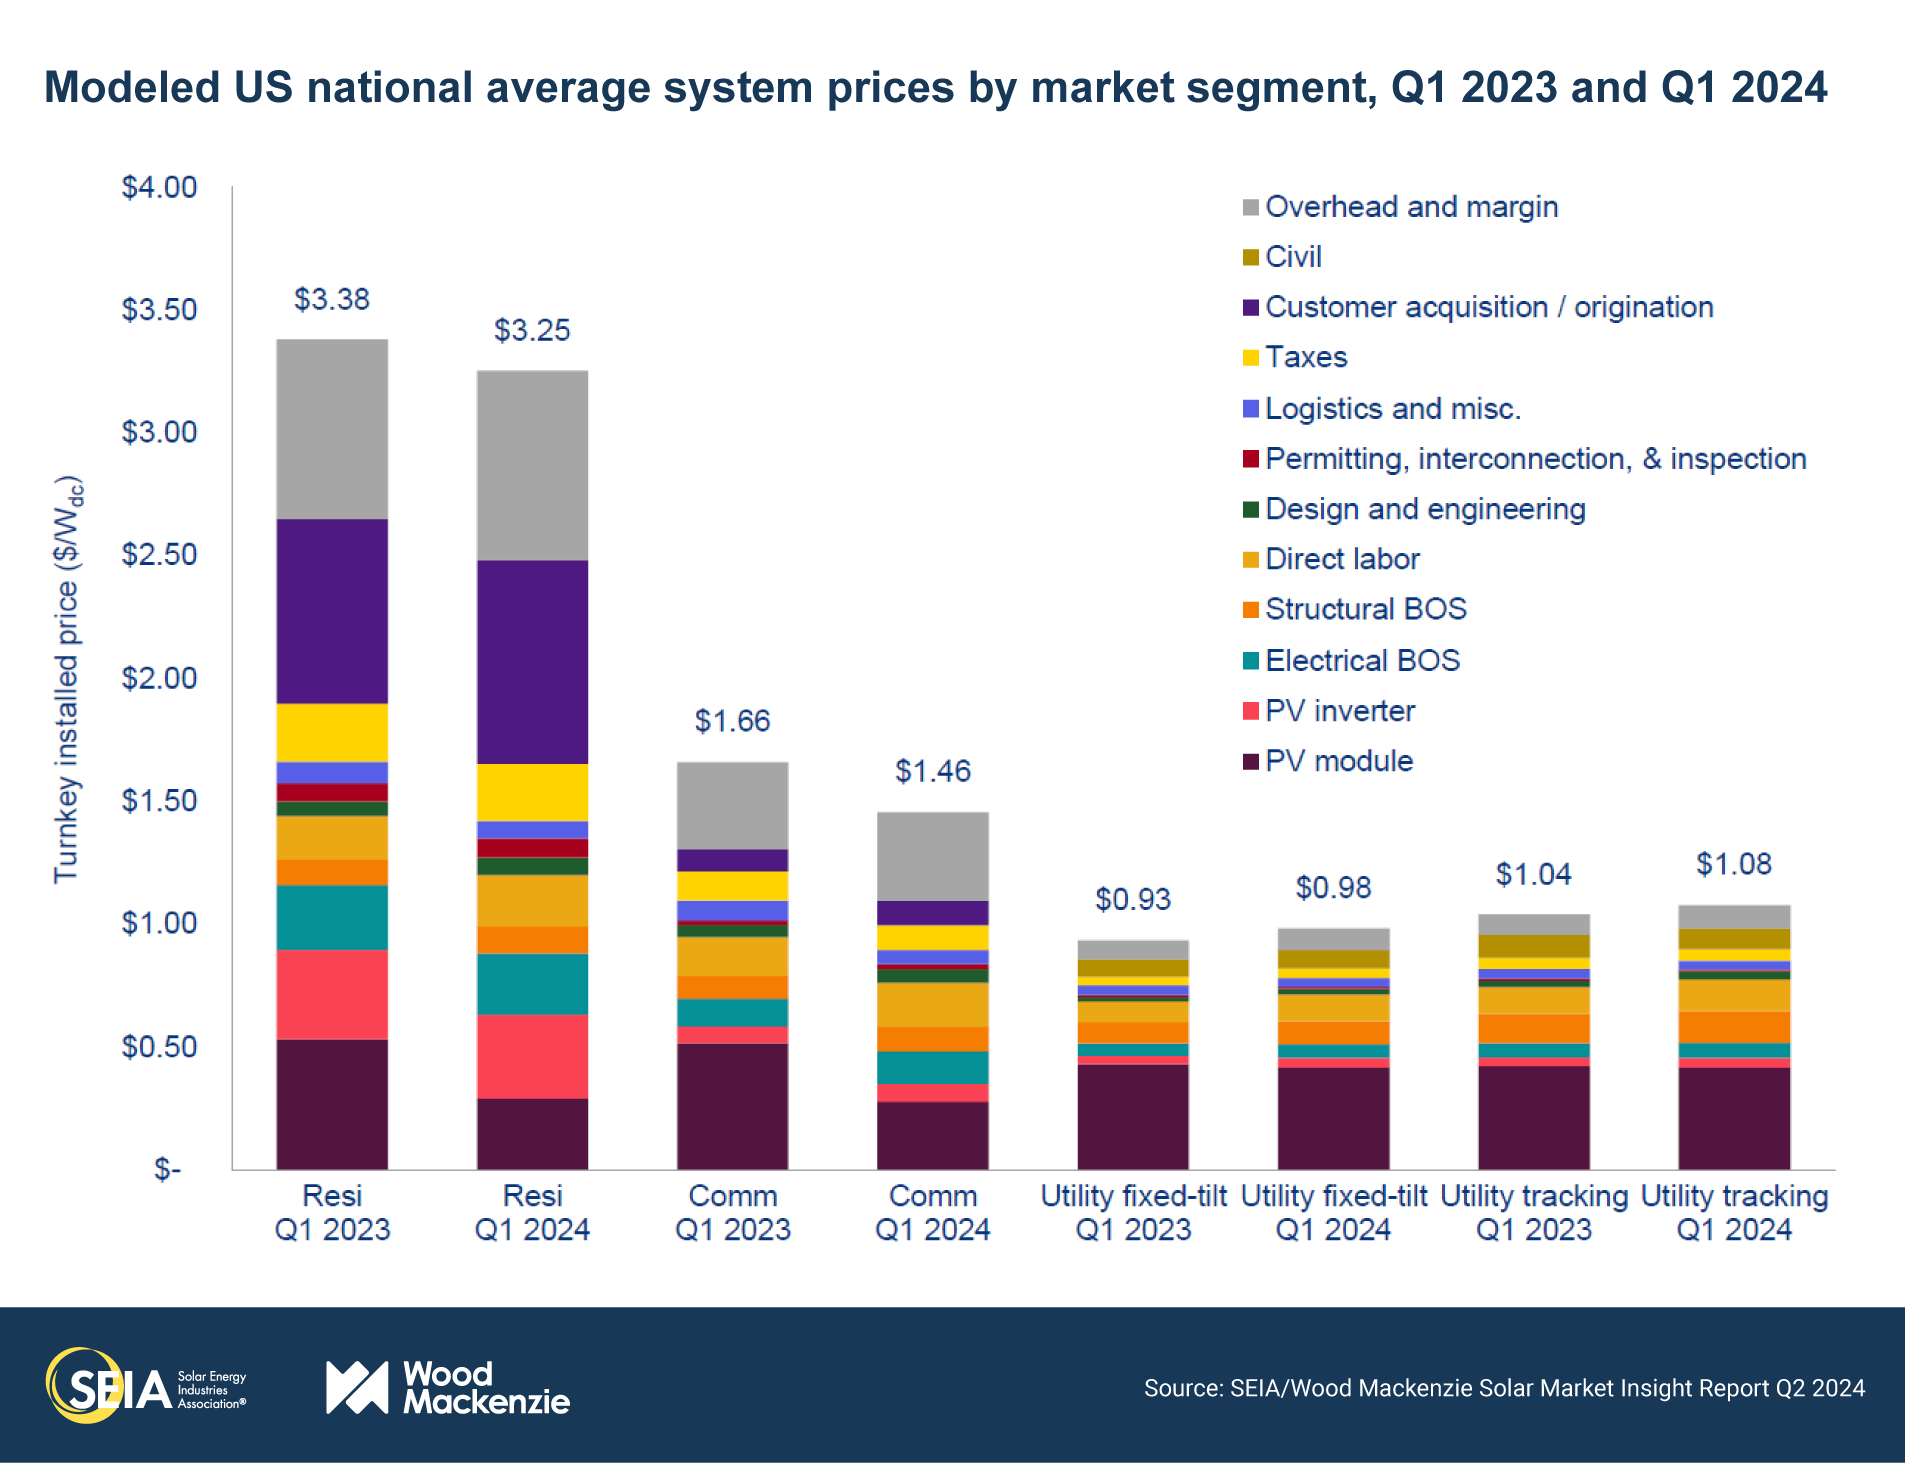
The decline in demand for residential solar contributed to a module supply/demand imbalance, resulting in lower module prices and declining system costs for the residential and commercial segments in Q1 2024. Costs decreased annually by 4% for residential and 12% for commercial PV systems, as module prices fell by an average of 45% over the year.
The average system cost for the utility-scale segment rose by 5% for fixed-tilt systems and 4% for single-axis tracking systems in Q1 2024 compared to Q1 2023. One of the main drivers of these increases is higher transformer costs, which surged by 25% year-over-year due to transformer supply shortages. Rising labor and engineering costs also contributed to the rise in utility-scale costs, as they increased by 23% and 22%, respectively, since Q1 2023.
License
Ownership rights
This report (“Report”) and all Solar Market Insight® (“SMI”)TM reports are jointly owned by Wood Mackenzie and the SEIA® (jointly, “Owners”) and are protected by United States copyright and trademark laws and international copyright/intellectual property laws under applicable treaties and/or conventions. Purchaser of Report or other person obtaining a copy legally (“User”) agrees not to export Report into a country that does not have copyright/intellectual property laws that will protect rights of Owners therein.
Grant of license rights
Owners hereby grant user a non-exclusive, non-refundable, non-transferable Enterprise License, which allows you to (i) distribute the report within your organization across multiple locations to its representatives, employees or agents who are authorized by the organization to view the report in support of the organization’s internal business purposes, and (ii) display the report within your organization’s privately hosted internal intranet in support of your organization’s internal business purposes. Your right to distribute the report under an Enterprise License allows distribution among multiple locations or facilities to Authorized Users within your organization.
Owners retain exclusive and sole ownership of this report. User agrees not to permit any unauthorized use, reproduction, distribution, publication or electronic transmission of any report or the information/forecasts therein without the express written permission of Owners.
Disclaimer of warranty and liability
Owners have used their best efforts in collecting and preparing each report.
Owners, their employees, affiliates, agents, and licensors do not warrant the accuracy, completeness, correctness, non-infringement, merchantability, or fitness for a particular purpose of any reports covered by this agreement. Owners, their employees, affiliates, agents, or licensors shall not be liable to user or any third party for losses or injury caused in whole or part by our negligence or contingencies beyond Owners’ control in compiling, preparing or disseminating any report or for any decision made or action taken by user or any third party in reliance on such information or for any consequential, special, indirect or similar damages, even if Owners were advised of the possibility of the same. User agrees that the liability of Owners, their employees, affiliates, agents and licensors, if any, arising out of any kind of legal claim (whether in contract, tort or otherwise) in connection with its goods/services under this agreement shall not exceed the amount you paid to Owners for use of the report in question.

