
1. Key figures
- In 2024, the US solar industry installed nearly 50 gigawatts direct current (GWdc) of capacity, a 21% increase from 2023. This was the second consecutive year of record-breaking capacity.
- Solar accounted for 66% of all new electricity-generating capacity added to the US grid in 2024, as the industry continued experiencing record growth.
- Domestic module manufacturing capacity grew an unprecedented 190% year-over-year, from just 14.5 GW at the end of 2023 to 42.1 GW at the end of 2024 and surpassed 50 GW in early 2025. This manufacturing is largely concentrated in the South, with 8.6 GW of capacity in Texas and 8.4 GW in Georgia. In 2024, cell manufacturing was reshored for the first time in five years as Suniva restarted production at its 1 GW factory in Georgia.
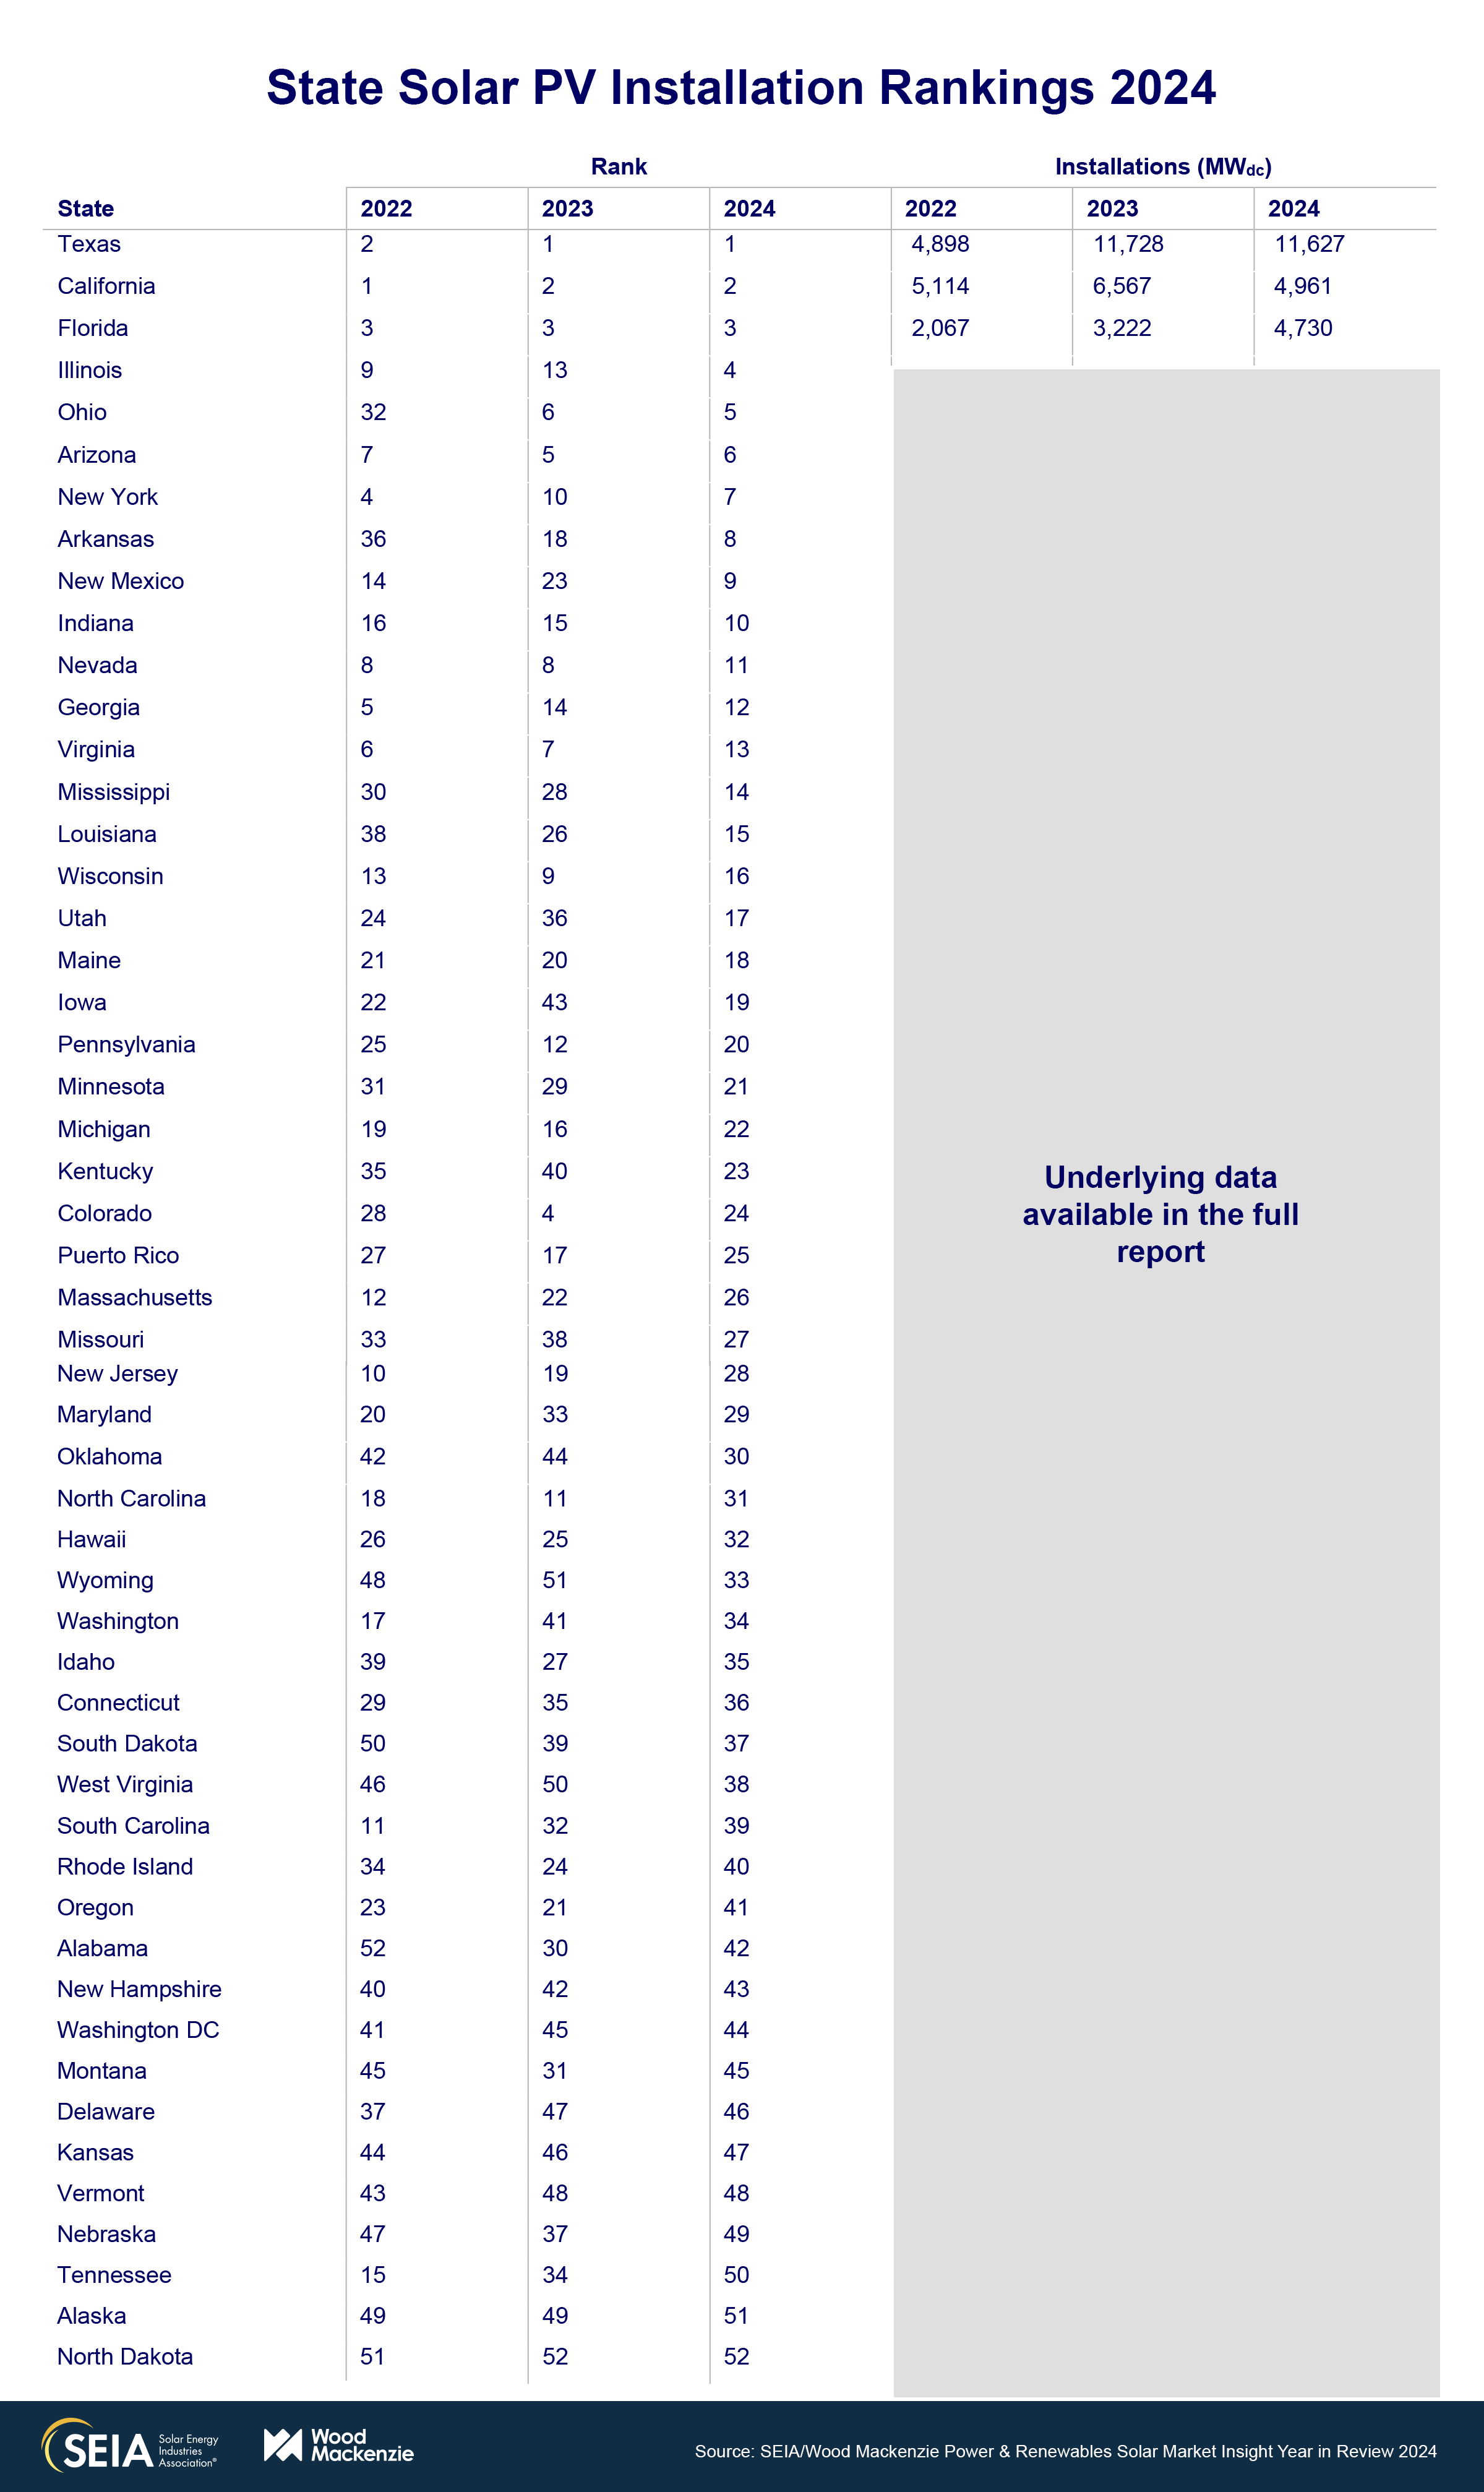
- In 2024, Texas maintained its position as the top-ranked state for new solar capacity installed for the second consecutive year, with 11.6 GWdc. California narrowly beat Florida for the second position, driven by significant installation volumes in the utility-scale and commercial segments.
- The residential segment installed 4,710 MWdc in 2024, a 32% decline from 2023. This was the segment’s lowest year of installed capacity since 2021, contributing to and impacted by company bankruptcies, sustained high interest rates, and consumer hesitancy ahead of the 2024 election. Forty-two states experienced annual contractions in capacity, with California declining by 45% year-over-year due to the net billing transition.
- The commercial solar segment installed 2,118 MWdc in 2024, setting an annual record with 8% year-over-year growth. Strong deployments in California, Illinois, New York, and Maine contributed to a solid fourth quarter to round out the year.
- The community solar segment installed 1,745 MWdc in 2024, marking its largest-ever year of capacity and a remarkable 35% increase over 2023. This growth was driven by record-breaking capacity additions in New York, Maine, and Illinois. Capacity in New York reached 861 MWdc, a 66% increase year-over-year as interconnection conditions improved.
- The utility-scale segment installed a record-breaking 41.4 GWdc in 2024, 33% year-over-year growth and the second consecutive annual record. Developers installed more than 16 GWdc in Q4 alone. More than a quarter of the nation’s capacity was installed in Texas.
- Our annual Year in review report includes a 10-year outlook for every segment. We expect cumulative US solar capacity to more than triple from 236 GWdc installed at year-end 2024, to 739 GWdc installed by 2035, with average annual capacity additions of more than 45 GWdc. This outlook is based on available information at the time of report publication.
- In the Year in review report, we also include our alternative scenarios (a High and Low case). Amidst considerable policy uncertainty, these scenarios consider different outcomes related to tax credit and tax equity availability, supply chain dynamics, interconnection, retail rate trends, federal and state policy, and the trajectory of interest rates. More details and data can be found in the full report.
2. Introduction
The US solar industry installed nearly 50 (49.99) GWdc of capacity in 2024, a remarkable 21% increase from 2023. The industry continued breaking records and experiencing unprecedented growth, accounting for 66% of all new generating capacity added in 2024. All solar segments set annual installation records except for residential solar, which experienced its lowest year of new capacity since 2021.
The factors driving installation growth in 2024 varied for each segment. Commercial solar installed 2,118 MWdc in 2024, setting an annual record and growing by 8% year-over-year. California Net Energy Metering (NEM) 2.0 projects continued to come online through the fourth quarter, and strong deployments in Illinois and Maine ahead of net metering deadlines contributed to a solid year for the segment. The community solar segment completed its largest-ever quarter in Q4, achieving an annual record of 1,745 MWdc in 2024. This growth was primarily driven by record-breaking capacity additions in New York, Maine, and Illinois. The utility-scale segment deployed more than 16 GWdc in Q4 alone, supported by high module inventory levels. For the residential segment, a significant contraction in the California market and the impact of sustained high interest rates nationwide contributed to a 31% year-over-year decline in 2024, with 4.7 GWdc of installed capacity.
2024 was the year of materialization of the IRA and the momentum will extend into 2025
Solar remains the generation technology of choice across the United States, as illustrated by the high level of demand in 2024. While 2023 was a year of recovery, 2024 was the year of materialization of the IRA. Solar installations more than doubled in 2024 compared to 2022, as supply chains have become more resilient and interest from utility and corporate offtakers soars. We expect 2025 installations to remain at similar levels to 2024 as policy uncertainty partially offsets high demand. The anticipated boom in data centers, the growing manufacturing base, and wider electrification of the economy could drive electricity demand to increase between 4% and 15% through 2029, depending on the region. More information on expected demand growth can be found in Wood Mackenzie’s Gridlock: the demand dilemma facing the US power industry.
After record-breaking installation levels in 2024, we expect a slight contraction in 2025 for the commercial, community, and utility-scale segments of 11%, 15%, and 2%, respectively. Reduced California NEM 2.0 backlogs and adaptation to the prevailing wage and apprenticeship requirements will contribute to a temporary commercial market slowdown. For the community solar segment, higher levels of penetration in mature state markets and a slow ramp-up of capacity in emerging markets due to interconnection challenges are leading to our expectations of a contraction this year. For utility-scale, more than half of the estimated capacity for the year is currently under construction. The pipeline of projects in late-stage development remains healthy and is expected to materialize this year.
The residential solar market will experience some recovery this year, with 9% growth. The segment experienced significant turmoil last year, with numerous installer and financier bankruptcies. Although interest rates declined, rate cuts occurred later in the year and were not as impactful to financing rates as expected. Further, installation volumes in California, the largest residential solar state market by far, declined by 45% in 2024 after the shift to net billing. We anticipate some stabilization for the residential solar market in 2025 as the California market levels out and the third-party ownership segment continues to grow rapidly with a focus on qualifying projects for the domestic content adder.
Looking at all the segments combined, we expect installations in 2025 to remain relatively flat at 49 GWdc.
US solar module manufacturing capacity triples
The US solar module manufacturing industry experienced record growth in 2024. Domestic module manufacturing capacity grew 190% year-over-year, from 14.5 GW at the end of 2023 to 42.1 GW at the end of 2024. This figure has grown to over 50 GW in early 2025.
Growth in upstream component manufacturing has been significantly slower, as these factories are more expensive and complex to develop. The US did reshore cell manufacturing in 2024 for the first time since 2019, with the restart of Suniva’s 1 GW Georgia factory. The start of ES Foundry’s South Carolina cell factory in January 2025 brought the country’s total crystalline silicon cell manufacturing capacity to 2 GW, in addition to First Solar’s 10.6 GW of domestic thin film capacity. However, other manufacturers who planned to begin cell production before the end of the year delayed, paused, or cancelled their plans. Therefore, many US-made crystalline silicon modules will continue to be made with imported cells as domestic cell factories ramp up throughout 2025 and into 2026. Both Hanwha Qcells and Silfab Solar are expected to start US cell production in 2025.
No companies brought wafer manufacturing online in 2024, and several have canceled or downsized their planned factories. In late 2024, the US government began to implement measures that could help domestic wafer manufacturing become more viable. This includes allowing solar wafer manufacturers to claim the 25% 48D CHIPS Act ITC in addition to the 45X PTC and incorporating wafers into the most recently released domestic content guidance safe harbor table. Hanwha Qcells is expected to begin operation of its US wafer facility in 2025.
The buildout of additional US polysilicon capacity hit a snag when REC Silicon shut down production at its Moses Lake, WA factory just a year after reopening. The company had difficulty producing polysilicon of the required purity levels. Its sole offtaker, Hanwha Qcells, stated it could no longer wait for a viable product and signed a new supply agreement for OCI polysilicon from Malaysia. With a limited potential customer base for US-made solar-grade polysilicon, REC Silicon has shifted its production focus to silicon gases.
President Trump’s flurry of executive orders brought uncertainty to the solar industry
During the first weeks of the new administration, President Trump issued a series of executive orders impacting industries including the energy sector. Several are aimed at promoting fossil fuels and rolling back climate change initiatives. The proposed measures have varying degrees of impact on each solar segment. We have identified some initiatives that are contributing to a challenging environment for the sector:
- Energy emergency declaration. President Trump declared an energy emergency, prioritizing thermal and hydropower generation over wind, solar and storage. We expect this order to expedite permitting and streamline environmental reviews for oil and gas projects while possibly slowing approvals for utility-scale solar plants, although it could benefit transmission development. However, the implementation and impact of this order are still uncertain.
- Federal land use. The new administration halted the issuance of key permits of renewable energy projects on federal lands for 60 days starting on January 20, 2025, unless approved by political leadership. Regions with a relatively higher share of projects on federal lands, such as the Southwest, will likely experience project delays. The effects of other executive actions, reductions in staff, and policy priorities could exacerbate delays.
- Federal funding freeze. The freeze on federal funding put Department of Agriculture and Department of Energy (DOE) grant recipients and the EPA’s Greenhouse Gas Reduction Fund (which includes the Solar for All program) in limbo. Organizations and companies in the distributed solar segments that depend on these funds had to pause or completely stop operations due to the uncertainty surrounding the availability of these funds. As of this report’s publication, some stakeholders who were awarded Solar for All funding and DOE grants confirmed the pause was lifted. However, the situation remains fluid, and we are not aware of any public, official programmatic announcements or guidance.
- New tariffs. President Trump has proposed multiple actions related to the imposition of tariffs on imports. The status of the tariffs continues to change. In addition, we note the new tariffs are additive, meaning they are in addition to other types of tariffs already in place, including standard duties and AD/CVD duties. As of this report’s publication, President Trump has imposed a 25% tariff on all imports from Canada and Mexico, effective March 4, 2025. Also effective March 4, he increased the new tariff on imports from China to 20%. He also modified the existing Section 232 tariffs on steel and aluminum imports (covering primary and derivative products), including changes to country and product coverage and raising the aluminum tariff rate from 10% to 25% (the steel tariff rate was already 25%). The US does not import modules, cells, wafers, or polysilicon from Canada, Mexico, or China at scale. Some electric balance of plant components are imported from Canada, but the impact of the tariff on total system pricing will be minimal. Most of the steel used for the structural balance of plant is sourced domestically. These tariffs have yet to have a significant impact on the solar industry.
The industry remains optimistic about the role of solar in achieving energy dominance and meeting rising electricity demand. State-level initiatives and corporate demand will gain more relevance and drive solar development, potentially mitigating the impact of federal mandates. AI and data center growth, combined with supply chain bottlenecks for large gas turbines, will position solar as the preferred technology to meet the growing demand, even more so if paired with storage.
A High case in which the tax credits remain in place with no changes, financing availability increases, and solar product supply availability remains high would increase the outlook by 24%
As in every Year in review report, our team of analysts modeled alternative scenarios that include several policy and economic factors that will drive solar development in the US.
In our High case, we envision that the tax credits and adders in the IRA remain unchanged, and any pending guidance is released expeditiously and generally favorable for developers. The ITC bonus adders, such as the energy community bonus, domestic content bonus, and low-income community bonus credits, remain at full value.
On the financing front, tax equity availability increases faster than anticipated as more corporate players participate in the transferability market, increasing the financing available for renewable energy projects. We assume that interest rates decline at a faster pace than in our Base case, reaching a Federal Reserve target range of 2.75% – 3% by the end of 2027, bringing down the cost of capital more quickly.
In this scenario, availability of solar product supply is high, and the supply chain is not a limiting factor to deployment.
We also assume that transmission projects are fast-tracked, and that smooth state-level collaboration promotes the construction of large interregional projects. Grid operators implement reforms that address queue backlogs faster than anticipated, allowing for expedited project approvals. High levels of corporate interest lead large tech companies to procure their own renewable assets both behind and in front of the meter, further driving demand.
Our High case results in a 24% increase in total solar installations through 2034 relative to the Base case, translating to an additional 118 GWdc of capacity. On an annual basis, the increase is smaller in the near term, averaging 13% over the next five years. Near-term installations are less sensitive to our assumptions given typical project timelines, particularly for utility-scale solar. But this annual increase grows to roughly 30% by the end of the outlook.
A Low case in which tax credits phase out early, the transferability market declines, and supply chain constraints increase would decrease the outlook by 25%
Our low case scenario presents a more challenging environment for the US solar industry and is directionally opposite to our High case.
In the low case, we see an early phase-out of the ITC, while the PTC is reduced to 80% of its original value in the near-term. All bonus ITC adders and direct pay provisions are eliminated early in the forecast period. These measures have a significant impact on project economics, particularly for tax-exempt entities.
We assume that tax equity availability struggles to keep up with demand as the tax basis decreases with the corporate tax rate reductions, limiting available financing for renewable projects. The transferability market also faces challenges, further constraining financing options. Interest rates remain at their current levels through our outlook, resulting in a sustained high cost of capital and weaker project economics.
The Low case also assumes solar product supply is more limited, which is driven by decreases in the imported solar product supply chain and more modest solar product domestic manufacturing buildout.
Lastly, permitting for renewable projects becomes lengthier and more complex. Proposed interconnection queue reforms are not approved by the Federal Energy Regulatory Commission (FERC) or fail to address backlogs, exacerbating already long lead times. Delayed fossil asset retirements reduce opportunity for new generation. Post-2030 load growth is supported by new gas build and non-conventional geothermal resources.
The Low case results in a 25% decrease in total solar installations through 2035 compared to the Base case, a reduction of 127 GWdc. Similar to the High case, the annual decreases are smaller in the near term but result in more than 40% lower capacity in some of the latter years of the outlook.
Forecast scenarios for annual solar installations
Our alternative scenarios show that, based on various policy decisions and economic outcomes, there could be nearly a 250 GWdc swing in solar installations over the next decade. We have included the most notable assumptions, but other factors contribute to our results. The full report provides more details on the assumptions for each segment.
US solar industry capacity will more than triple over the next decade
In our Base case outlook, the US solar industry will add more than 375 GWdc by 2035. Over the next decade, cumulative solar installations will exceed 730 GWdc, compared to 236 GWdc installed as of year-end 2024. We expect annual capacity levels of at least 43 GWdc between 2025 and 2035. But after the significant growth that occurred in 2023 and 2024, challenges related to interconnection delays and labor availability will constrain future solar development. Plus, market penetration continues to reach higher levels in many states. Overall, this contributes to our expectations of a 1% average annual contraction over the next 10 years.
US solar PV installations and Base case forecasts by segment, 2014-2035
3.1. Residential PV
- 4,742 MWdc installed in 2024, 1,155 MWdc in Q4 2024
- Down 31% from 2023
The residential solar market experienced its first annual contraction since 2017, declining by 31%
Residential solar market turbulence persisted throughout 2024. The segment added 4,742 MWdc in 2024, a 31% decline compared to 2023 and the lowest year of installed capacity since 2021. The market started with a slow first quarter, in line with the typical seasonal pattern of residential solar installations, and the industry was optimistic for recovery in the second half of the year. Installed capacity failed to bounce back as financiers and top installers filed for bankruptcy. Interest rate cuts did not translate to lower financing costs or a sizable uptick in demand. After declining through the third quarter, national residential solar installations ticked up slightly in Q4, but it was still the smallest fourth quarter since 2020.
Installers continued to experience challenging conditions in 2024, facing high customer acquisition costs, financier instability, and cash flow constraints. Overall, 42 states experienced declines in annual installed capacity last year. Despite a 45% year-over-year contraction due to the net billing transition, California continued to lead the residential solar state rankings in 2024. Florida remained the second-ranked state, followed by Illinois, where deployment was driven by a rush to complete installations before the net metering deadline at the end of the year. As a result, Illinois was one of the few states to grow in 2024.
We downgraded our residential solar outlook this quarter. After a more challenging 2024 than anticipated, and continued headwinds, we reduced our 2025 forecast by 16% and five-year outlook by 15% overall. However, Wood Mackenzie still expects some recovery for the segment in 2025, with 9% year-over-year growth. The California market will stabilize, increasing by 7% compared to 2024, as installers have gained proficiency with selling solar-plus-storage. There is considerable federal policy uncertainty but not a substantial impact on the future viability of the segment based on actions taken so far. The residential solar market will continue to grow steadily, driven by retail rate inflation, resiliency concerns, product innovation, and third-party ownership momentum with a focus on ITC adder qualification. In our Base case forecast, the segment will more than triple over the next decade, adding more than 96 GWdc by 2035.
3.2. Commercial PV
- 2,118 MWdc installed in 2024, 653 MWdc installed in Q4 2024
- Up 8% from 2023
Note on market segmentation: Commercial solar encompasses distributed solar projects with commercial, industrial, agricultural, school, government, or nonprofit offtakers, including remotely net-metered projects. This excludes community solar (covered in the following section).
Driven by NEM 2.0 installations, California led the charge for another record year in commercial solar
2024 was another record-breaking year for the commercial solar segment, with 2.1 GWdc of new capacity installed, an 8% increase from 2023. Last year, California represented 34% of the total national installed capacity, with 11% year-over-year growth, primarily due to NEM 2.0 installations coming online. Commercial solar installation growth in 2024 was also driven by interest in new segments and unique financing options, such as universities and Rural Energy for America Program federal grants.
The commercial segment grew by 18% quarter-over-quarter in Q4 2024, driven by strong installation volumes in Illinois, Maine, and New York, in addition to California. These states made up 70% of new installed capacity in Q4 2024. However, smaller markets like Texas, Ohio, and Pennsylvania also contributed to the segment’s record growth last year. Many areas in the Midwest and Southern regions of the US are appealing to commercial solar developers due to low development costs, minimal building penetration, abundant land to achieve economies of scale, and rising retail rates.
Wood Mackenzie forecasts an 11% contraction in 2025 as installers adapt to prevailing wage and apprenticeship requirements. Developers accelerated pipeline buildout before these rules took effect, leading to a temporary installation surge in the past two years. Installations will dip in 2026 due to an expected reduction in California’s installations following the switch to the net billing tariff policy and increased market penetration in more mature markets. We expect the market to bounce back in 2027 with continued growth into 2028 and 2029, primarily due to increased retail rates and more projects qualifying for the ITC adders. We expect 8% average annual growth over the next five years.
Commercial solar installations and Base case forecast, 2020-2029
3.3. Community solar PV
- 1,745 MWdc installed in 2024, 749 MWdc installed in Q4 2024
- Up 35% from 2023
Note on market segmentation: Community solar projects are part of formal programs where multiple residential and non-residential customers can subscribe to the power produced by a local solar project and receive credits on their utility bills.
Annual community solar capacity additions in 2024 surpassed a record-breaking 1.7 GWdc
Community solar installations increased by 35% year-over-year in 2024, resulting in 1,745 MWdc of new capacity and a record-breaking year for the segment. Installed capacity in New York and Maine drove this impressive growth, with Q4 2024 volumes greatly exceeding previous expectations. The two states installed 861 MWdc and 370 MWdc of new capacity in 2024, respectively, accounting for 71% of national community solar volumes. Illinois also had a particularly strong year, with capacity additions totalling 213 MWdc, an 82% increase compared to 2023. Cumulative installed community solar capacity now totals 8.6 GWdc, nearly double what it was in 2021.
Beyond the top markets, other state programs fell short. Massachusetts, for example, recorded its lowest year of installed capacity since 2015, with volumes declining 16% compared to 2023. Additionally, the ramp-up of capacity in emerging state markets like Virginia and Delaware has been extremely slow due to interconnection challenges, and no projects in Delaware have come online through Q4 2024. While we expect growth in these smaller state markets will pick up in 2025, the persistence of interconnection challenges and program size caps limit the potential for long-term growth.
Despite impressive national volumes in 2024, we expect capacity additions to level off beginning this year, contracting 8% on average annually through 2029. However, cumulative capacity is still on track to break 15 GWdc by 2030. Leading state markets, including New York and Illinois, will remain dominant but are quickly reaching a saturation point and cannot maintain the same levels of growth long-term. Importantly, our five-year outlook includes only state markets with active programs and does not include those with proposed program legislation, leaving upside potential if new legislation is passed. Although early administration actions have fueled uncertainty across the US solar industry, material actions so far have resulted in minimal changes to our Base case outlook for the community solar segment.
Community solar installations and Base case forecast, 2020-2029
3.4. Utility PV
- 41.4 GWdc installed in 2024, 16.2 GWdc installed in Q4 2024
- Up 33% from 2023
- Over 356 GWdc of utility-scale solar will be added between 2025 and 2035 in our Base case
Utility-scale segment achieves its strongest year of installations in 2024
The utility-scale sector installed 16.2 GWdc of projects in Q4 2024. The high level of installations in Q4 pushed the segment to achieve its strongest year on record, with 41.3 GWdc installed in 2024. Despite the large volume of quarterly installations, Q4 2024 represents a 13% decline year-over-year. Nearly 70% of installations were concentrated in seven states: Texas, California, Illinois, Florida, Indiana, Ohio, and Virginia.
A total of 7.3 GWdc of projects were contracted in Q4 2024, representing a 17% decline year-over-year. Nearly 60% of projects contracted in Q4 2024 had large technology corporate buyers such as Meta, Google, and Amazon to support their growing energy needs and clean energy goals. The bulk of projects with corporate off-takers was in Texas, with the highest activity coming from Meta’s PPA contracts. Nearly 1 GWdc of projects was contracted in Q4 2024 by NYSERDA as a result of solar projects rebidding their contracts from their original 2021 and 2022 request for proposals. Arizona Public Service contracted 1.3 GWdc of solar projects in Q4 2024 in response to rising data center loads.
In our Base Case outlook, Wood Mackenzie forecasts that the utility-scale segment will add 356 GWdc of installed capacity between 2025 and 2035. Installation momentum from 2024 will continue into 2025, but installed capacity will start to plateau and decline starting in 2026 from a contraction in the overall pipeline. Rising energy demand from AI and data centers, coupled with supply chain issues for large gas turbines, serves as an upside for utility-scale, as the segment is well positioned to help meet this expected growth when paired with storage. Due to the prevalence of solar and storage in the project pipeline and these technologies’ relatively short development timelines, growing energy demand cannot be met without significant solar and storage deployment. The different buildout levels presented in the alternative scenarios account for the impacts of tax credit adders, tax equity availability, labor availability, supply chain dynamics, implementation of federal interconnection reforms, and state-level permitting.
Utility-scale installations and Base case forecast, 2020-2035
4. US solar PV forecasts
5. National solar PV system pricing
- Residential system pricing is up 2% year-over-year
- Commercial system pricing is down 7% year-over-year
- Utility-scale system pricing is down 4% for fixed-tilt and single-axis tracking year-over-year
Wood Mackenzie employs a bottoms-up modeling methodology to capture, track and report national average PV system pricing by segment for systems installed each quarter. The methodology is based on the tracked wholesale pricing of major solar components and data collected from industry interviews. Wood Mackenzie’s Supply Chain data and models are leveraged to enhance and bolster our pricing outlooks. New this quarter: Wood Mackenzie assumes that all system costs are incurred in the year in which the project is being contracted, and no procurement or construction lags are being factored into the pricing. Module prices for all segments are also now reflective of ‘overnight’ pricing and do not account for any procurement or delivery lags (previously, modules for the utility segment were assumed to be procured one year prior to the project’s commercial operation). The utility segment data no longer breaks out taxes as a separate line item as those are incorporated in the equipment category estimates. These changes have been made to the current system prices as well as historical 2023 prices.
Modeled US national average system prices by market segment, Q4 2023 and Q4 2024
The residential segment system price landed at $3.36/Wdc in Q4 2024, up 2% compared to Q4 2023. This uptick is driven by an 8% year-over-year increase in customer acquisition costs, which were $0.87/Wdc in Q4 2024. Residential solar demand remains low, forcing installers to increase their marketing spend to acquire new customers.
System prices for the commercial and utility-scale segments declined 7% and 4% year-over-year, respectively, in Q4 2024. Module prices dropped by an average of 18% in 2024 across both segments. Manufacturers adjusted module prices to respond to polysilicon prices declining by 11%. Comparatively, module prices in 2023 were high due to the supply squeeze from the anti-circumvention ruling on imports from manufacturers in Cambodia, Malaysia, Thailand and Vietnam. In Q4 2024, the commercial PV system price reached $1.46/Wdc, and the utility segment’s system price fell to $1.05/Wdc for fixed-tilt and $1.18/Wdc for single-axis tracking systems.
License
Ownership rights
This report (“Report”) and all Solar Market Insight® (“SMI”)TM reports are jointly owned by Wood Mackenzie and the SEIA® (jointly, “Owners”) and are protected by United States copyright and trademark laws and international copyright/intellectual property laws under applicable treaties and/or conventions. Purchaser of Report or other person obtaining a copy legally (“User”) agrees not to export Report into a country that does not have copyright/intellectual property laws that will protect rights of Owners therein.
Grant of license rights
Owners hereby grant user a non-exclusive, non-refundable, non-transferable Enterprise License, which allows you to (i) distribute the report within your organization across multiple locations to its representatives, employees or agents who are authorized by the organization to view the report in support of the organization’s internal business purposes, and (ii) display the report within your organization’s privately hosted internal intranet in support of your organization’s internal business purposes. Your right to distribute the report under an Enterprise License allows distribution among multiple locations or facilities to Authorized Users within your organization.
Owners retain exclusive and sole ownership of this report. User agrees not to permit any unauthorized use, reproduction, distribution, publication or electronic transmission of any report or the information/forecasts therein without the express written permission of Owners.
Disclaimer of warranty and liability
Owners have used their best efforts in collecting and preparing each report.
Owners, their employees, affiliates, agents, and licensors do not warrant the accuracy, completeness, correctness, non-infringement, merchantability, or fitness for a particular purpose of any reports covered by this agreement. Owners, their employees, affiliates, agents, or licensors shall not be liable to user or any third party for losses or injury caused in whole or part by our negligence or contingencies beyond Owners’ control in compiling, preparing or disseminating any report or for any decision made or action taken by user or any third party in reliance on such information or for any consequential, special, indirect or similar damages, even if Owners were advised of the possibility of the same. User agrees that the liability of Owners, their employees, affiliates, agents and licensors, if any, arising out of any kind of legal claim (whether in contract, tort or otherwise) in connection with its goods/services under this agreement shall not exceed the amount you paid to Owners for use of the report in question.

