Solar Market Insight Report 2021 Q3
The quarterly SEIA/Wood Mackenzie Power & Renewables U.S. Solar Market InsightTM report shows the major trends in the U.S. solar industry. Learn more about the U.S. Solar Market Insight Report. Released September 14, 2021.
1. Key Figures
- In Q2 2021, the US solar market installed 5.7 GWdc of solar capacity, a 45% increase over the second quarter of 2020 and the largest Q2 on record.
- With Q2 additions, the US officially surpassed 3 million installations across all market segments, the vast majority of which are residential systems.
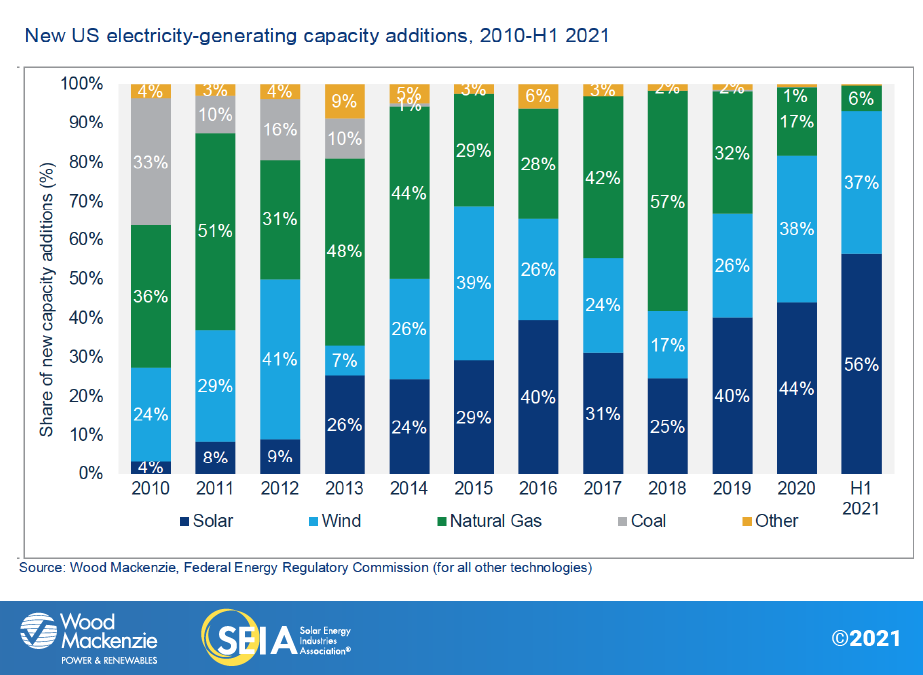
- Solar accounted for 56% of all new electricity-generating capacity added in the US in the first half of 2021.
- Residential solar was up 2% over Q1 2021, but up 46% from Q2 2020 when installations were hit hardest by the Covid-19 pandemic. With 974 MWdc installed, volumes were on par with Q4 2020 – the largest quarter on record.
- Community solar was up 16% over Q2 2020 with 177 MWdc installed, and commercial solar was up 31% over the same quarter last year with 354 MWdc installed.
- Utility-scale solar set another record for second-quarter installations at 4.2 GWdc. Texas, Arizona, and Florida accounted for nearly 3 GW of the quarterly total.
- A total of 9.3 GWdc of new utility-scale solar power purchase agreements were signed in Q2 2021, bringing the utility-scale contracted pipeline to nearly 85 GWdc.
- Before the investment tax credit (ITC) fully phases down under current law, the solar industry will continue to break annual installation records every year for the next three years. Wood Mackenzie has increased our outlook from 2021 to 2026 thanks to the continued growth of project pipelines and high demand for solar projects.
- Despite promising growth in the US solar industry, forecasted volumes remain lower than what’s required to meet President Biden’s climate goals.
- Supply chain constraints, the recent Withhold Release Order (WRO) from the US government on solar imports, and the potential for expanded and extended tariffs from recent trade petitions pose downside risks to near-term growth.
2. Introduction
Note on market segmentation: Wood Mackenzie has modified how we cover specific market segments. The former “non-residential” segment has been split into “commercial solar” and “community solar.” See more specific definitions in the market segment outlook sections. We continue to use “non-residential” to refer to these two market segments combined.
The US solar industry hit another record in the second quarter of 2021, with 5.7 GW-direct current (GWdc) of capacity installed, more than any other Q2 in the industry’s history. In the first half of 2021, nearly 11 GWdc of solar has come online, more than most of the annual installation volumes from the past decade. The solar industry also surpassed 3 million solar installations, the majority of which are residential. Wood Mackenzie estimates that 4.7% of viable owner-occupied homes in the US will have a residential solar system by the end of this year.
Every segment experienced quarter-over-quarter growth in Q2 2021 except for commercial solar, where variability in quarterly installation volumes is more common. Utility solar set another Q2 record, with 48% growth over Q2 2020. Overall, solar PV accounted for 56% of all new electricity-generating capacity additions in the first half of 2021. Solar continues to make up the largest share of new generating capacity in the US.
Supply chain constraints lead to price increases for every solar segment
Ongoing supply chain constraints and commodity price increases began to have a significant impact on solar prices during the second quarter of 2021. For the first time since Wood Mackenzie began tracking system price data, prices are up both quarter-over-quarter and year-over-year across every segment. The most significant price increases have come from higher input costs (steel, aluminum, etc.) and elevated freight costs. As a result, prices have increased the most for utility solar because equipment for these projects – namely modules – tends to be sourced internationally. Distributed solar, by contrast, sources more modules and racking domestically.
Developers are responding in a few different ways. Some developers have renegotiated PPAs, but others are honoring existing contracts and accepting lower margins. Developers are cost-cutting where they can, and adding contract language to account for potential equipment price increases. New contracts initiated today will certainly be more expensive, and customers will have shorter timeframes to decide on offered pricing.
Equipment delivery delays are also forcing developers to make tradeoffs. Agreed upon pricing from vendors can usually be honored, but on a delayed delivery schedule. Developers must decide if it’s worthwhile to get their projects completed faster, but with more expensive equipment and possible project redesign. This is slightly easier for distributed solar projects where the equipment makes up a smaller share of the overall system cost and project designs are more flexible. Large, utility-scale projects are typically designed around specific equipment parameters for modules and trackers.
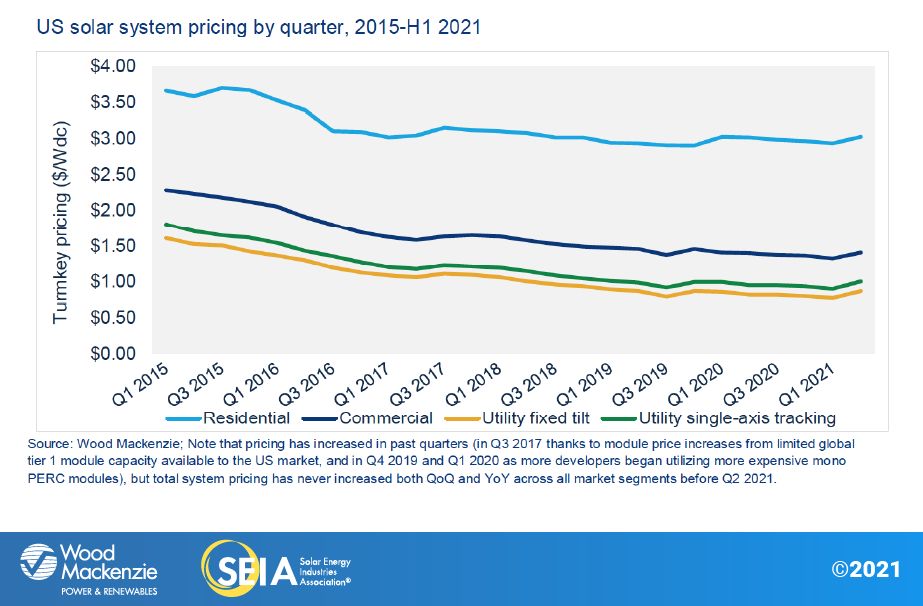
Source: Wood Mackenzie; Note that pricing has increased in past quarters (in Q3 2017 thanks to module price increases from limited global tier 1 module capacity available to the US market, and in Q4 2019 and Q1 2020 as more developers began utilizing more expensive mono PERC modules), but total system pricing has never increased both QoQ and YoY across all market segments before Q2 2021.
Despite these concerns, installations in 2021 are less likely to be impacted by these issues than those slated for 2022. For 2022 projects, many developers took the wait-and-see approach, aiming to delay non-critical procurement decisions to avoid buying equipment at peak prices. Many developers and distributors report that they have sufficient inventory to get through the rest of 2021. Wood Mackenzie’s view is that supply chain constraints are unlikely to negatively impact long-term demand. Strong demand for solar means that projects are more likely to be delayed than canceled. However, some projects are already suffering, particularly those that can’t currently receive equipment.
WRO and possible trade actions present potential downside risks
The US government’s WRO on metallurgical-grade silicon (MGS) from certain companies with facilities in China’s Xinjiang region only adds to the complexity of the industry’s supply chain constraints. The first major enforcement of the WRO came in August when roughly 100 MW of equipment was detained from a major module vendor.
This is a concern for the industry because of a high burden of proof required by US Customs and Border Protection (CBP); the CBP requires information on the source MGS for modules entering the US. The ultimate impacts of the WRO depend on two factors: CBP’s enforcement strength and the readiness of solar manufacturers and importers to show documented evidence that their equipment is not subject to the WRO. SEIA is updating its Supply Chain Traceability Protocol to help address CBP’s requests for visibility further upstream.
Based on conversations with industry stakeholders, Wood Mackenzie remains confident that manufacturers can adjust their supply chains. But the WRO represents a significant, widespread downside risk to our near-term outlooks. When the CBP detains equipment, the subsequent inquiry process takes at least 90 days. As the CBP conducts its first inquiry processes and adjusts its requirements for the industry, it’s possible that more solar equipment will be detained, potentially delaying projects.
In addition to WRO enforcement, fast-developing trade action also poses a downside risk to the industry. Unnamed companies have petitioned the US International Trade Commission to impose the same anti-dumping and countervailing duties (AD/CVD) that are currently applied to Chinese crystalline silicon cells and modules to certain companies using Chinese wafers for cell production in Malaysia, Thailand and Vietnam. These countries account for roughly 80% of crystalline silicon module imports, and duties could average 50% or more, creating the potential for widespread module price impacts. While it’s still too early to tell the likelihood of these trade actions, they clearly pose a significant risk to the industry.
Federal action on solar policy rides on the budget reconciliation bill
The bipartisan $1 trillion infrastructure bill that passed the Senate in early August included transmission investments but did not include key clean energy investments. Instead, Democrats aim to include these policies in a budget reconciliation bill, which only requires a simple majority to pass in the Senate. These could include an ITC extension along with a production tax credit (PTC) extension with the ability for any solar or wind facility to choose between the two, the creation of a standalone storage ITC, clean energy requirements, and direct pay provisions for the ITC and PTC. As we reported last quarter, any one of these would have major implications for the solar industry. The specific policies for this budget reconciliation bill are currently under development; the White House has argued such policies are crucial for reaching President Biden’s climate targets. While House leadership has publicly committed to a vote on the reconciliation bill before October 1st, negotiation of such a large package is fraught with obstacles and possible delays.
3. Market segment outlooks
3.1. Residential PV
Key figures
- 974 MWdc installed in Q2 2021
- Up 46% from Q2 2020
- Up 2% from Q1 2021
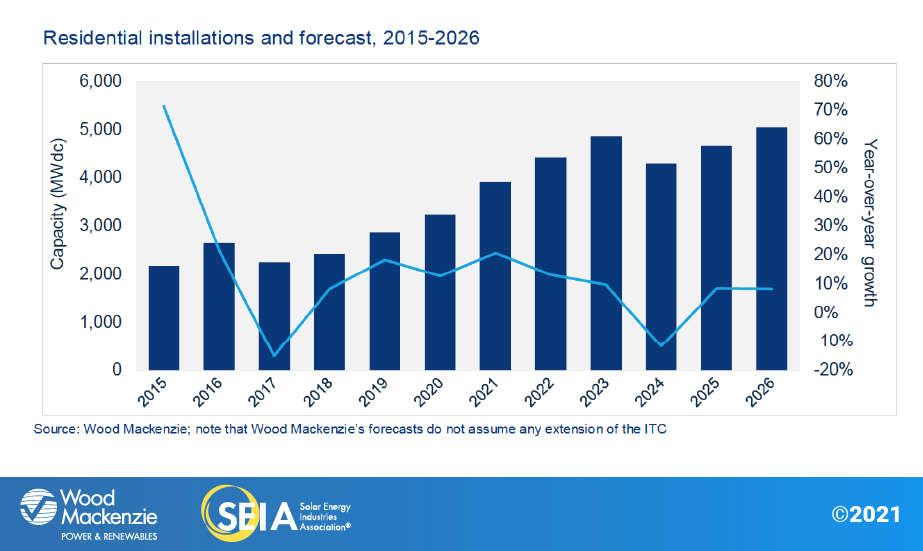
Residential solar installations in the first half of 2021 continue to demonstrate strong market growth. Installers completed 974 MWdc of projects in Q2 2021, falling just shy of the 979 MWdc record set in Q4 2020 for the most residential solar capacity installed in one quarter. As has become typical, California (317 MWdc), Florida (88 MWdc), and Texas (81 MWdc) led the way with the most capacity installed during the quarter.
Installers began Q2 by ramping up for the spring sales boom. Many continued to report record-breaking sales months as the quarter ended, which has yielded robust project pipelines. This should translate into strong installation performance through the second half of 2021, despite the lack of an ITC stepdown to create demand pull-in.
While supply chain constraints and permitting and labor challenges persist, none of these factors are preventing robust growth in the residential segment as consumer demand remains high. Wood Mackenzie forecasts 21 percent year-over-year growth in 2021 as the market tops 3.9 GWdc. Installed capacity will grow in the low double-digits in 2022 and 2023, leading up to the final ITC stepdown. After shrinking in 2024, the market will begin a post-ITC recovery and see growth in the high single-digits in 2025 and 2026. Further cost declines and storage-paired systems will be key growth drivers mid-to-long term.
3.2. Commercial PV
Key figures
- 354 MWdc installed in Q2 2021
- Up 31% from Q2 2020
- Down 2% from Q1 2021
Note on market segmentation: Commercial solar encompasses distributed solar projects with commercial, industrial, agricultural, school, government or nonprofit offtakers, including remotely net-metered projects. This excludes community solar (covered in the following section).
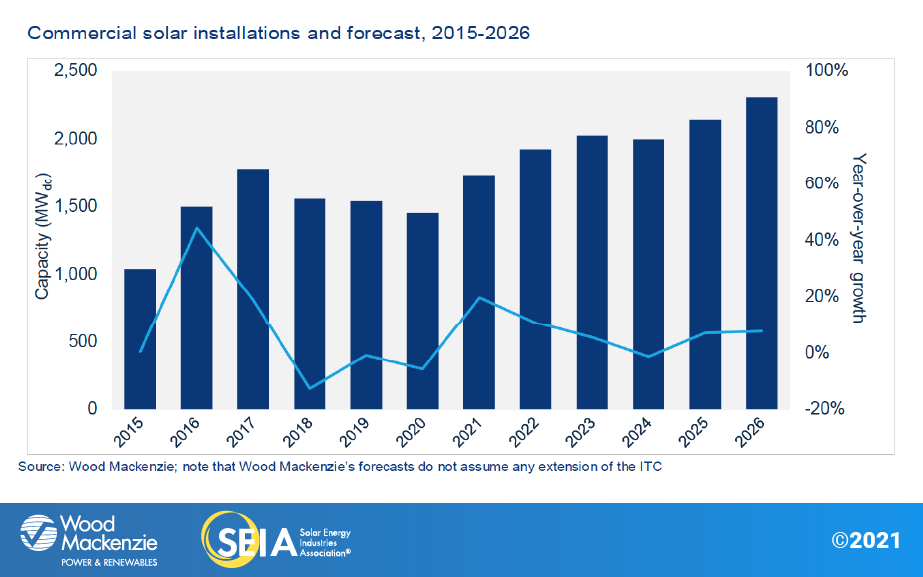
With 715 MWdc of capacity installed so far, the commercial solar industry is on track for 20% year-over-year growth in 2021. As we reported last quarter, this will be the largest annual increase since 2016. While growth is expected to be lower next year (11%), we’ve increased our 2022 outlook by roughly 70 MWdc thanks to a few key factors.
The first is project delays from 2021 to 2022. Developers are either waiting for delayed equipment delivery, or for commodity prices to come down before proceeding with procurement. And in Maine and Massachusetts, projects are delayed by transmission-level interconnection studies. The second factor is higher growth in New Jersey. The state’s solar successor program was finalized in July and represents the most significant uplift to our commercial solar outlook this quarter. But it will also cause a rush to develop projects under the current (more lucrative) Transition Incentive program before it expires. A more detailed analysis of this is included in the full report.
Beyond 2022, annual growth will average 5% as costs continue to decline while the ITC phases down.
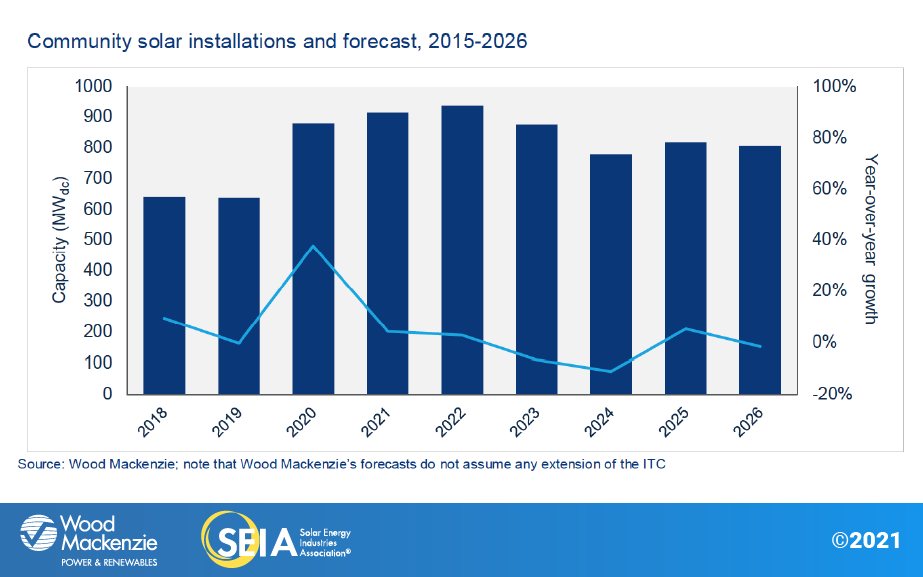
3.3. Community solar PV
Key figures
- 177 MWdc installed in Q2 2021
- Up 16% from Q2 2020
- Up 10% from Q1 2021
Note on market segmentation: Community solar projects are part of formal programs where multiple customers can subscribe to the power produced by a local solar project and receive credits on their utility bills.
Community solar installations in Q2 2021 grew both quarter-over-quarter and year-over-year. The community solar market is expected to have a record-setting year. Large project pipelines currently under construction or close to completion bode well for capacity additions in the second half of 2021. Though growth in some states will help 2021 stay on pace to be a very successful year, a few markets are underperforming due to interconnection delays and siting and policy challenges. Maine, a promising new community solar market, has hundreds of megawatts wrapped up in interconnection studies, while historically strong community solar markets Minnesota and Colorado face siting constraints and programmatic rate changes. As a result, we have decreased the near-term forecasts for these states.
Overall, Wood Mackenzie has increased the five-year community solar outlook by 7% since last quarter’s forecast. The new Successor Solar Incentive program in New Jersey and increased confidence in the near-term New York market drive this increase. Meanwhile, emerging community solar states like Oregon and Virginia contribute to slightly higher long-term volumes.
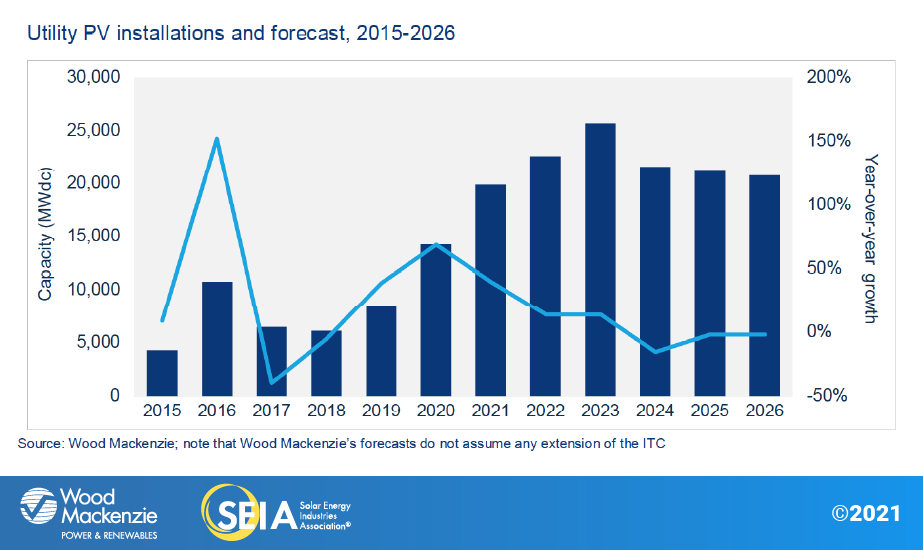
3.4. Utility PV
Key figures
- 3.63 GWdc installed in Q1 2021, the largest first quarter on record
- 6.2 GWdc of new utility-scale solar contracts were signed
- The contracted pipeline now totals nearly 77 GWdc
The utility solar sector had its largest Q2 on record with 4.23 GWdc installed, despite the challenges of high commodity prices and supply chain uncertainties. The pipeline remains robust, with 19.4 GWdc of projects under construction, 10.2 GWdc of which are slated to come online this year and another several gigawatts under contract. As a result, 2021 is shaping up to be a recording-breaking year with 19.9 GWdc of forecasted annual capacity.
In the second quarter of 2021, 9.3 GWdc of new contracts were signed, growing the project pipeline to a historic level of 85 GWdc. The sector will see double-digit annual growth through 2023 as developers build out pipelines they accrued at the 26% ITC level. Even as the ITC steps down to 10% by 2024, the utility-scale solar sector will remain at least a 20 GWdc annual market between 2024 and 2026 thanks to the growing demand for clean energy and the decreasing cost of solar.
Although the infrastructure legislation under consideration in Congress could establish multiple mechanisms to further incentivize solar development, there are also significant downside risks to the forecast. High component costs and supply chain challenges, particularly those related to the WRO, create headwinds for projects slated to come online in 2022 and early 2023. Additionally, constraints on tax equity and EPC capacity may affect smaller-size projects, while interconnection constraints affect projects of all sizes.
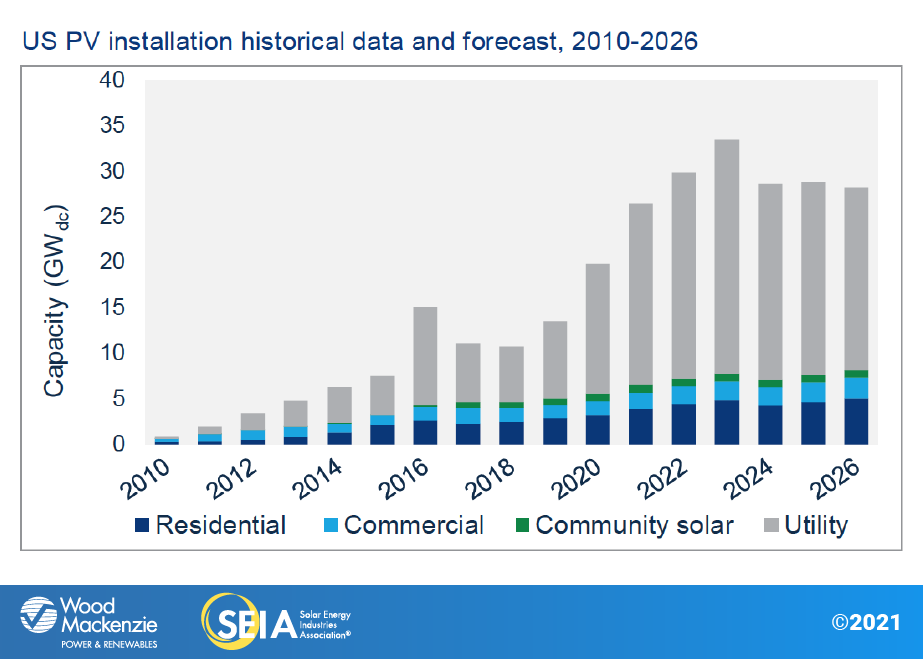
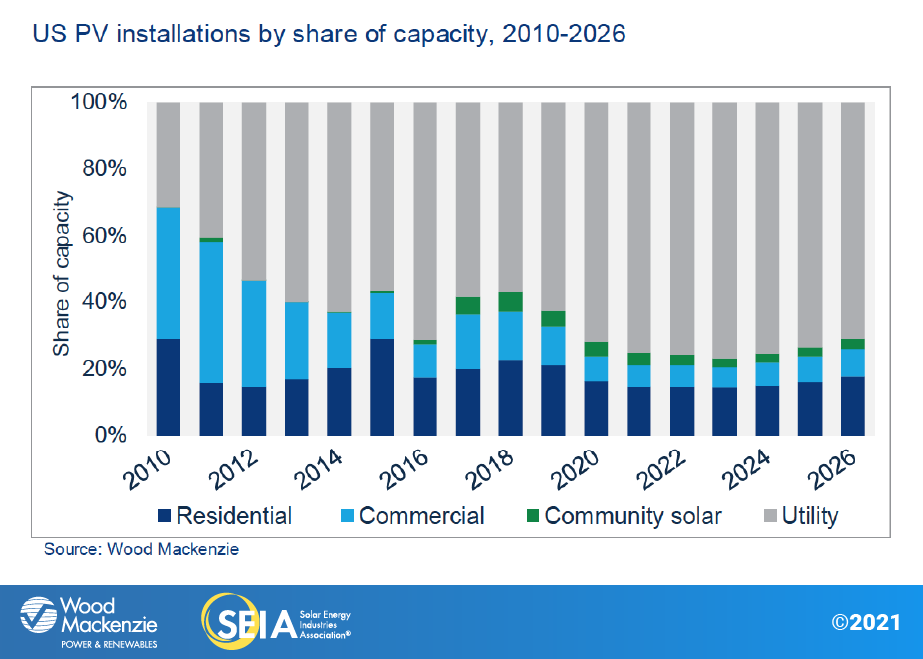
4. U.S. solar PV forecasts
5. National solar PV system pricing
We employ a bottom-up modeling methodology to capture, track and report national average PV system pricing by segment for systems installed each quarter. Our methodology is based on the tracked wholesale pricing of major solar components and data collected from industry interviews. We report a weighted average of multi-silicon and mono-PERC solar modules for the non-residential and utility segments, and a weighted average of standard mono-PERC and high-efficiency modules for the residential segment. Wood Mackenzie assumes all product is procured and delivered in the same year as the installation, for all market segments.
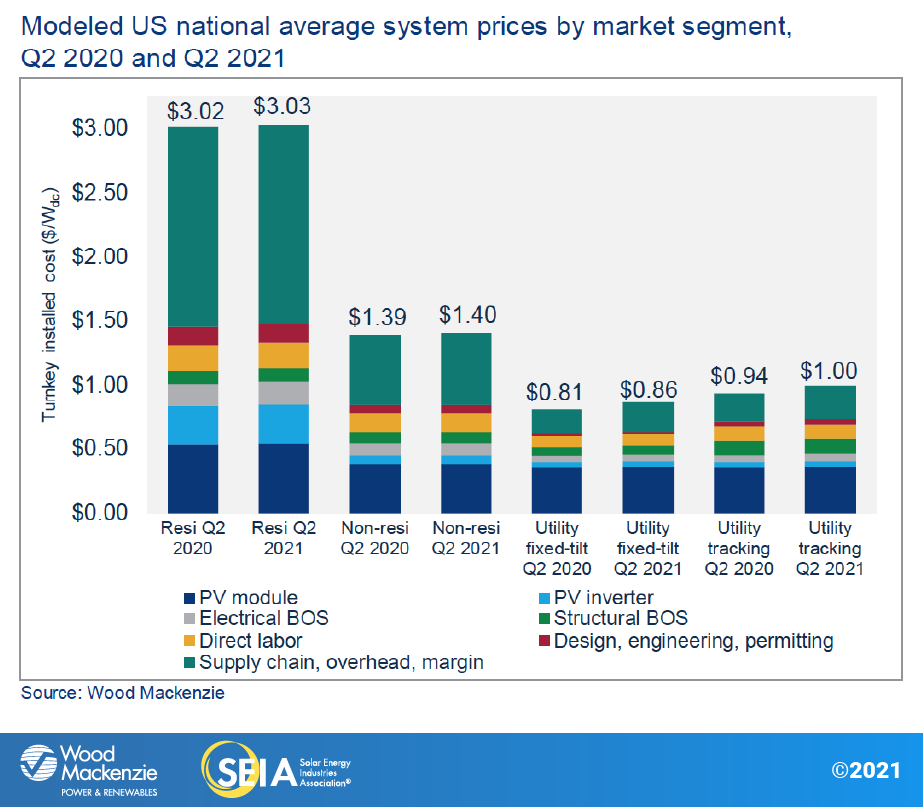
In Q2 2021, system pricing increased both year-over-year and quarter-over-quarter across all market segments for the first time since Wood Mackenzie started benchmarking this data in 2014. System pricing increased quarter-over-quarter by 3.2%, 6.3%, 12.5% and 11.6% in the residential, non-residential, utility fixed-tilt and utility single-axis tracking markets, respectively. Average system prices mostly increased due to increased equipment costs, raw material input costs and freight costs. Utility-scale system prices increased more than residential and commercial prices due to the hardware representing a larger share of overall cost, and a higher share of equipment coming from overseas. Further, the utility-scale segment has tighter project margins and less room for increased cost absorption relative to distributed solar.
About the Report
U.S. solar market insight® is a quarterly publication of Wood Mackenzie and the Solar Energy Industries Association (SEIA)®. Each quarter, we collect granular data on the U.S. solar market from nearly 200 utilities, state agencies, installers and manufacturers. This data provides the backbone of this U.S. Solar Market Insight® report, in which we identify and analyze trends in U.S. solar demand, manufacturing and pricing by state and market segment over the next five to ten years. All forecasts are from Wood Mackenzie, Limited; SEIA does not predict future pricing, bid terms, costs, deployment or supply. The report includes all 50 states and Washington, D.C. National totals reported also include Puerto Rico and other U.S. territories. Detailed data and forecasts for 50 states and Washington, D.C. are contained within the full version of the report.
References and Contact
-
References, data, charts and analysis from this executive summary should be attributed to “Wood Mackenzie/SEIA U.S. solar market insight®.”
-
Media inquiries should be directed to Wood Mackenzie’s PR team (WoodmacPR@woodmac.com) and Morgan Lyons (mlyons@seia.org) at SEIA.
-
All figures are sourced from Wood Mackenzie. For more detail on methodology and sources, click here.
About the Authors
Wood Mackenzie Power & Renewables | U.S. Research Team
Michelle Davis, Principal Analyst (lead author)
Bryan White, Solar Analyst
Rachel Goldstein, Solar Analyst
Xiaojing Sun, Head of Global Solar
Molly Cox, Solar Analyst
Kelsey Gross, Solar Analyst
Sylvia Leyba Martinez, Senior Analyst
Matthew Sahd, Research Associate
Solar Energy Industries Association | SEIA
Shawn Rumery, Director of Research
Colin Silver, Chief of Staff and Chief Content Officer
Justin Baca, Vice President of Markets & Research
Note on U.S. solar market insight report title: The report title is based on the quarter in which the report is released, not the most recent quarter of installation figures.
License
Ownership rights
This report (“Report”) and all Solar Market Insight® (“SMI”)TM reports are jointly owned by Wood Mackenzie and the Solar Energy Industries Association (SEIA)®(jointly, “Owners”) and are protected by United States copyright and trademark laws and international copyright/intellectual property laws under applicable treaties and/or conventions. Purchaser of Report or other person obtaining a copy legally (“User”) agrees not to export Report into a country that does not have copyright/intellectual property laws that will protect rights of Owners therein.
Grant of license rights
Owners hereby grant user a non-exclusive, non-refundable, non-transferable Enterprise License, which allows you to (i) distribute the report within your organization across multiple locations to its representatives, employees or agents who are authorized by the organization to view the report in support of the organization’s internal business purposes, and (ii) display the report within your organization’s privately hosted internal intranet in support of your organization’s internal business purposes. Your right to distribute the report under an Enterprise License allows distribution among multiple locations or facilities to Authorized Users within your organization.
Owners retain exclusive and sole ownership of this report. User agrees not to permit any unauthorized use, reproduction, distribution, publication or electronic transmission of any report or the information/forecasts therein without the express written permission of Owners.
Disclaimer of warranty and liability
Owners have used their best efforts in collecting and preparing each report.
Owners, their employees, affiliates, agents, and licensors do not warrant the accuracy, completeness, correctness, non-infringement, merchantability, or fitness for a particular purpose of any reports covered by this agreement. Owners, their employees, affiliates, agents, or licensors shall not be liable to user or any third party for losses or injury caused in whole or part by our negligence or contingencies beyond Owners’ control in compiling, preparing or disseminating any report or for any decision made or action taken by user or any third party in reliance on such information or for any consequential, special, indirect or similar damages, even if Owners were advised of the possibility of the same. User agrees that the liability of Owners, their employees, affiliates, agents and licensors, if any, arising out of any kind of legal claim (whether in contract, tort or otherwise) in connection with its goods/services under this agreement shall not exceed the amount you paid to Owners for use of the report in question.

