Solar Market Insight Report 2020 Q4
The quarterly SEIA/Wood Mackenzie Power & Renewables U.S. Solar Market InsightTM report shows the major trends in the U.S. solar industry. Learn more about the U.S. Solar Market Insight Report. Released December 15, 2020.
1. Key Figures
- In Q3 2020, the U.S. solar market installed 3.8 GWdc of solar PV, up 9% from Q2 as the industry began recovering from the worst impacts of the pandemic.
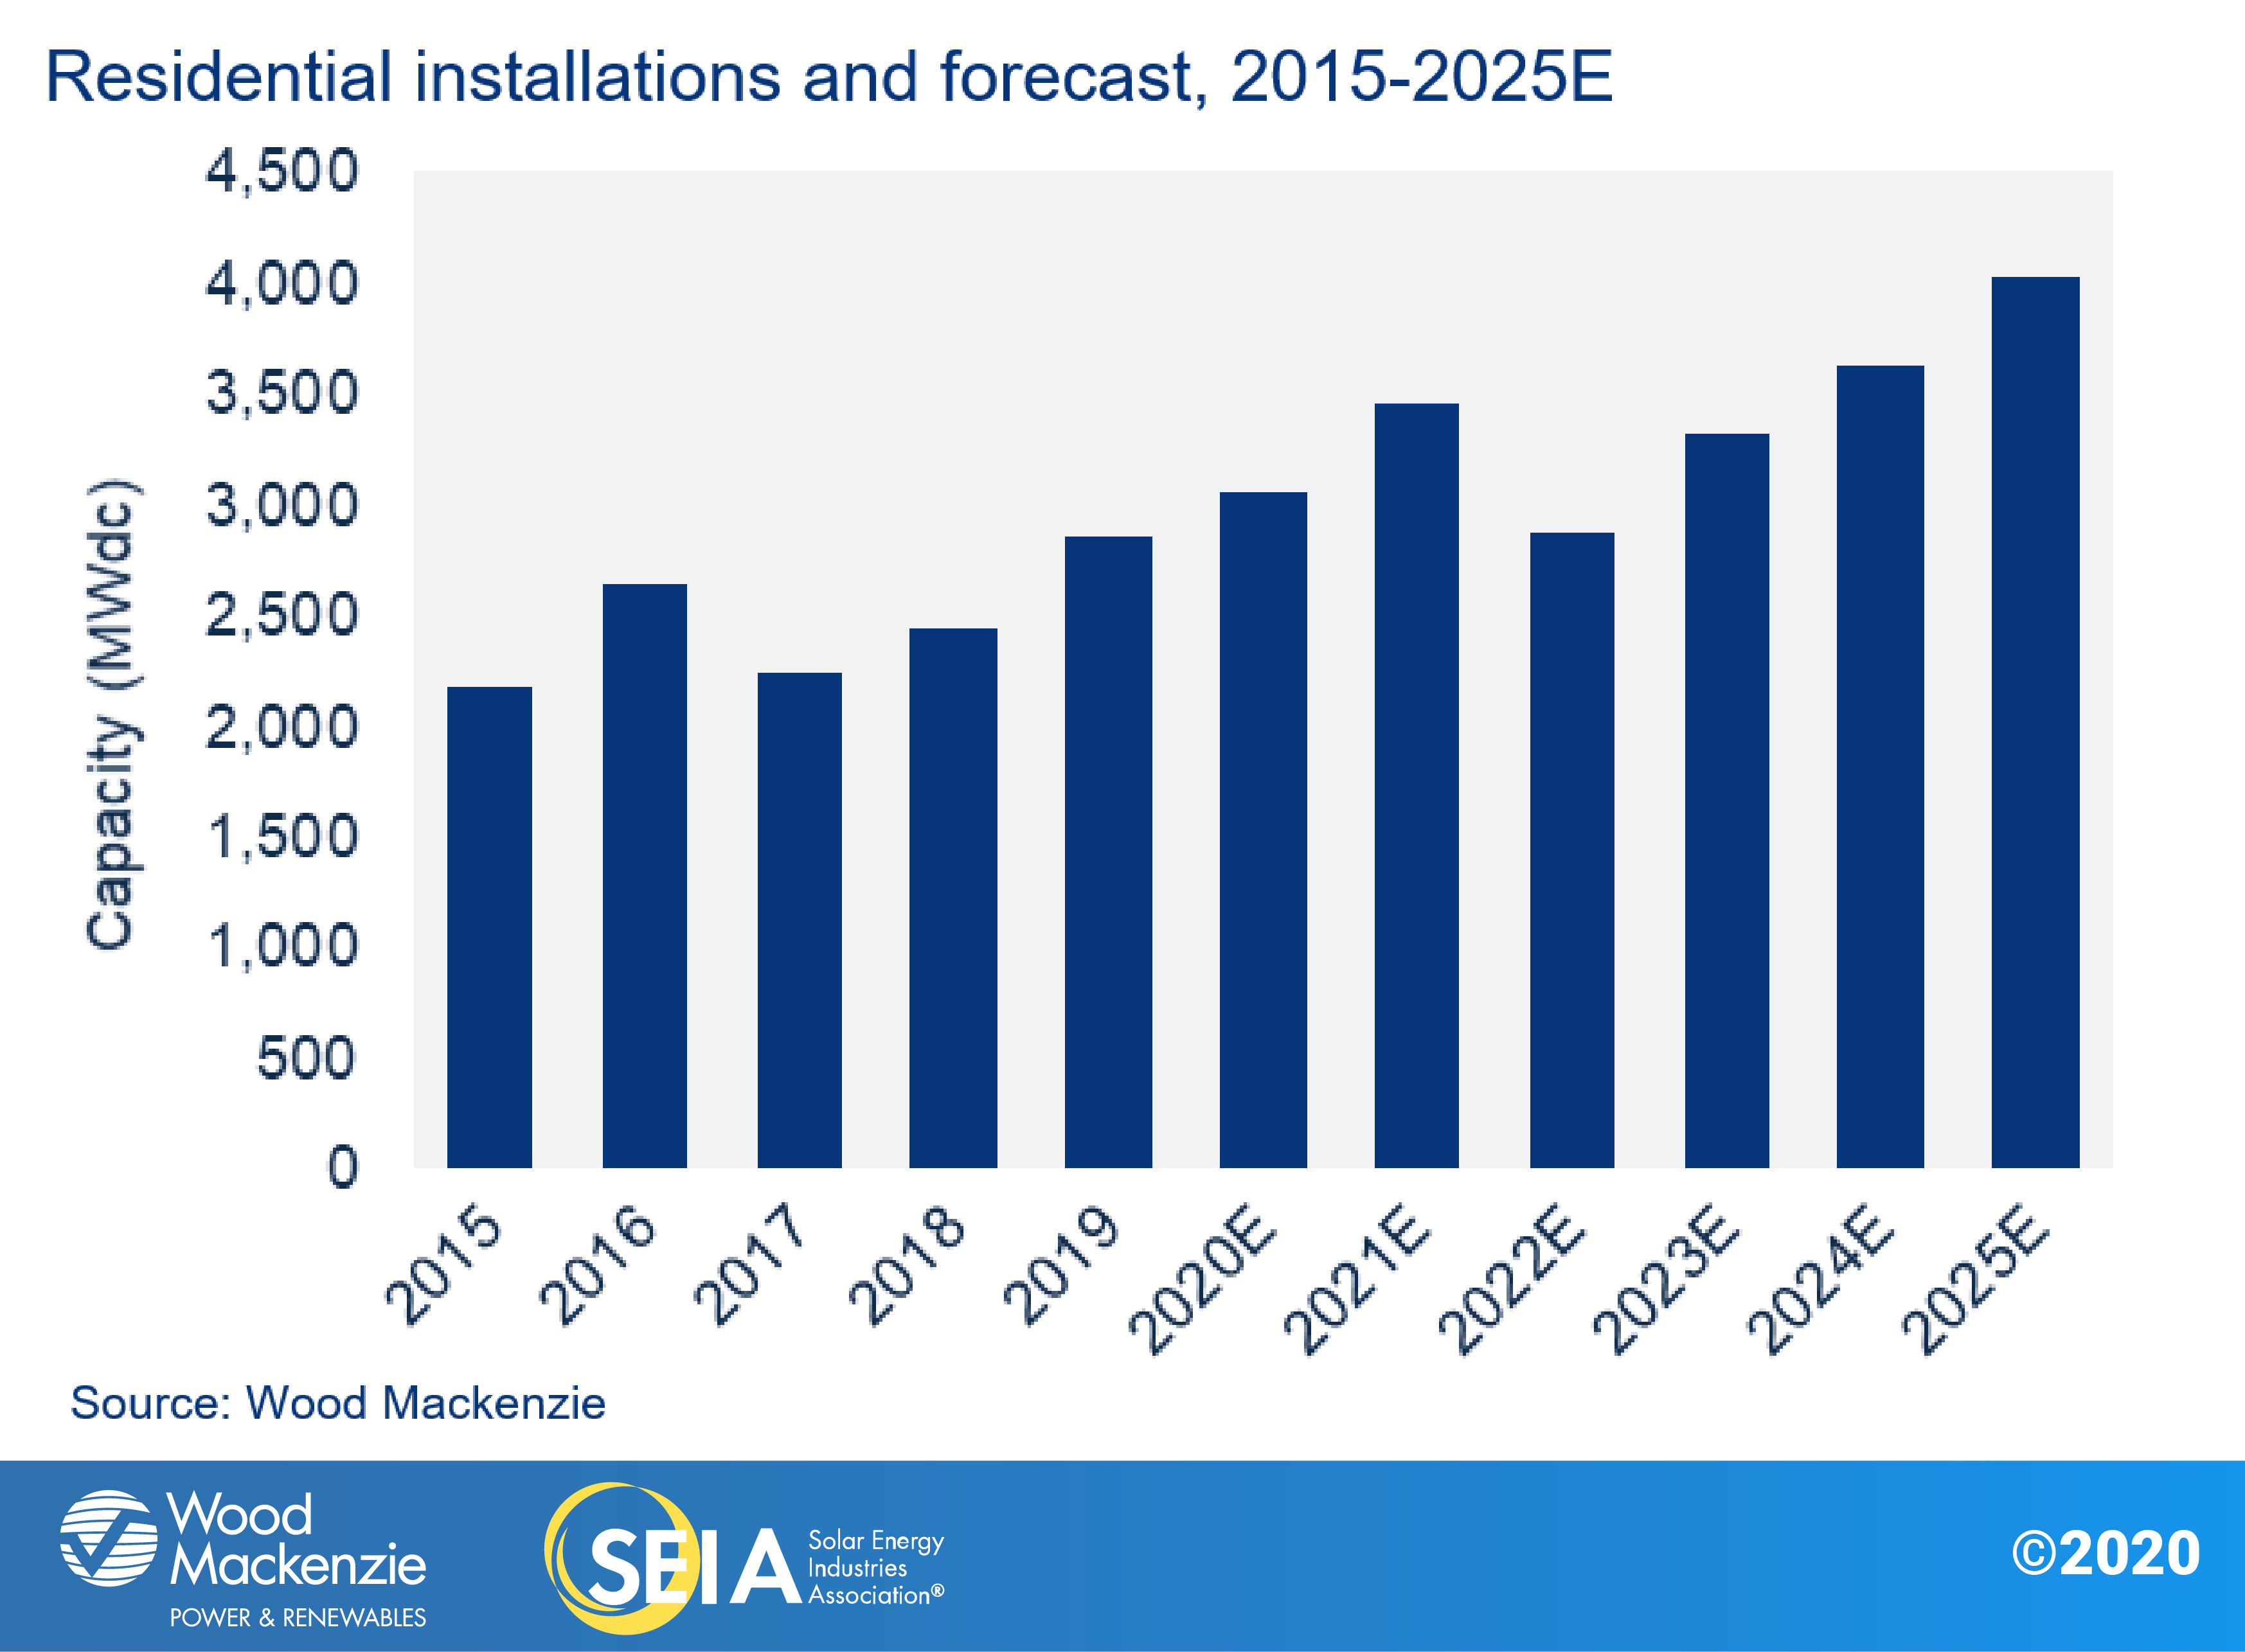
- Residential installations were up 14% from Q2 to Q3 2020 after shelter-in-place orders during the spring caused the largest quarterly decline in history in the second quarter.
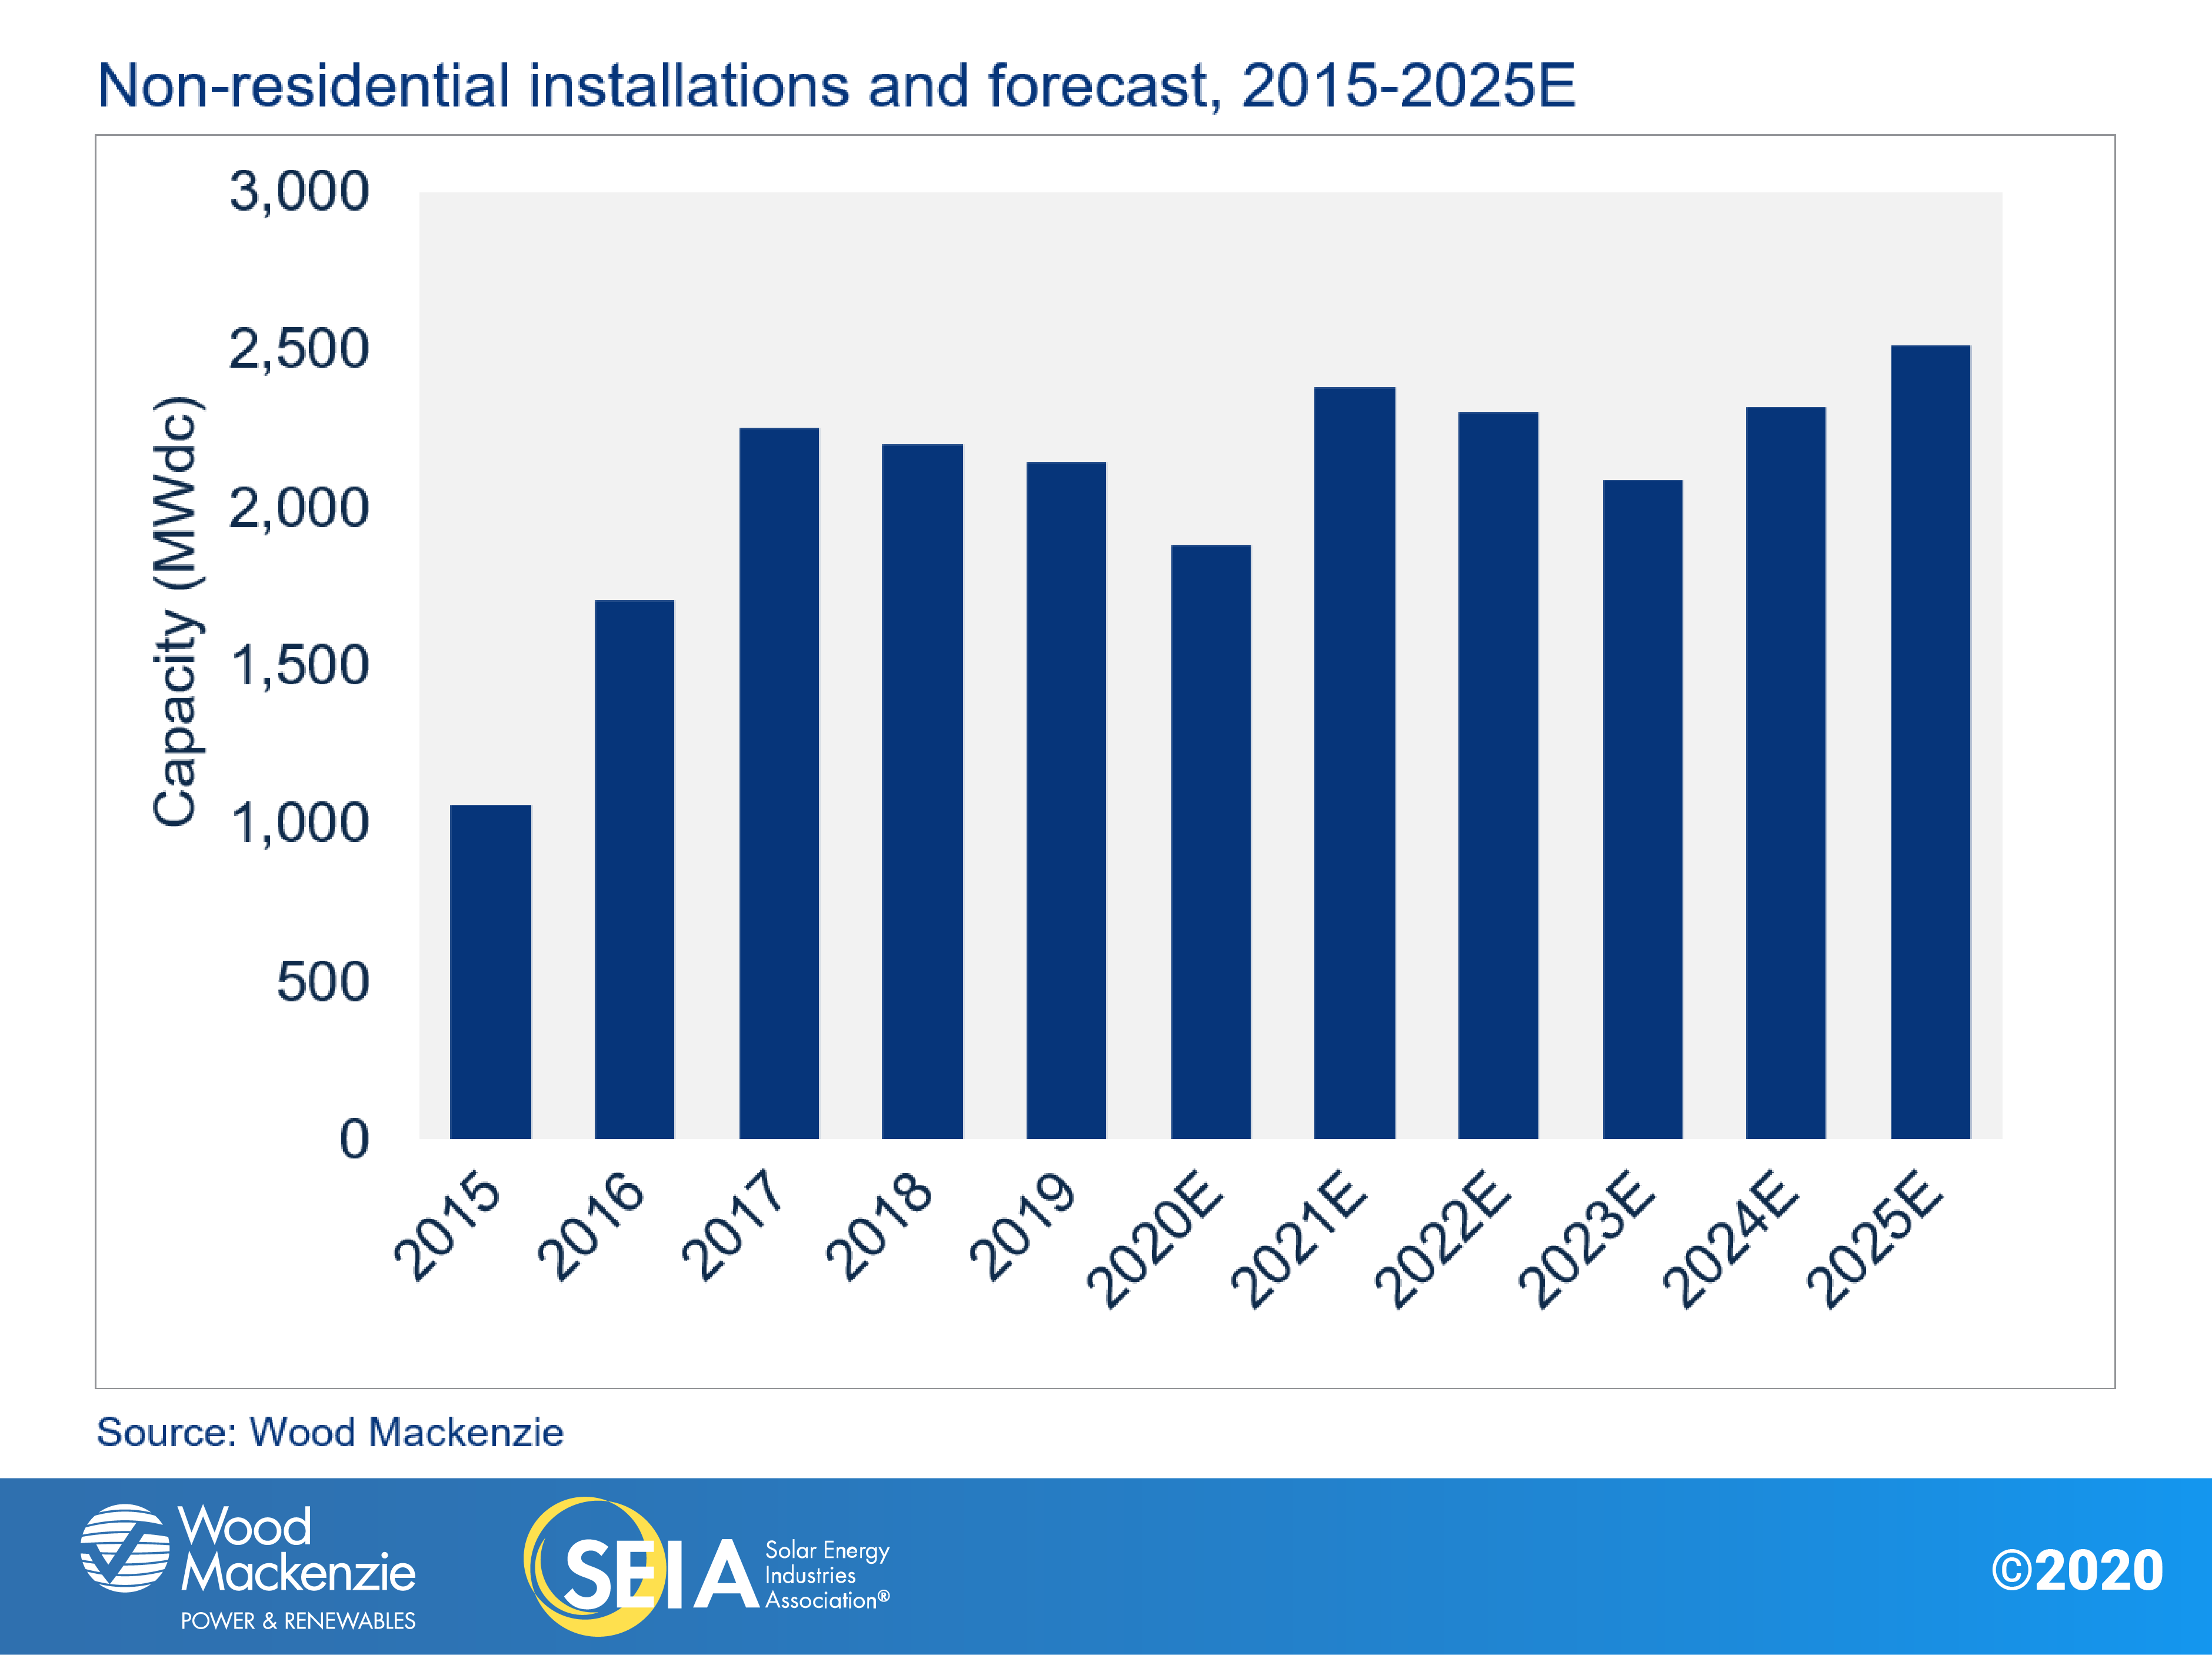
- Non-residential installations were up 8% from last quarter but still down 13% from Q3 2019. The lifting of pandemic-related restrictions helped accelerate project completions but such restrictions complicated and delayed development timelines overall.
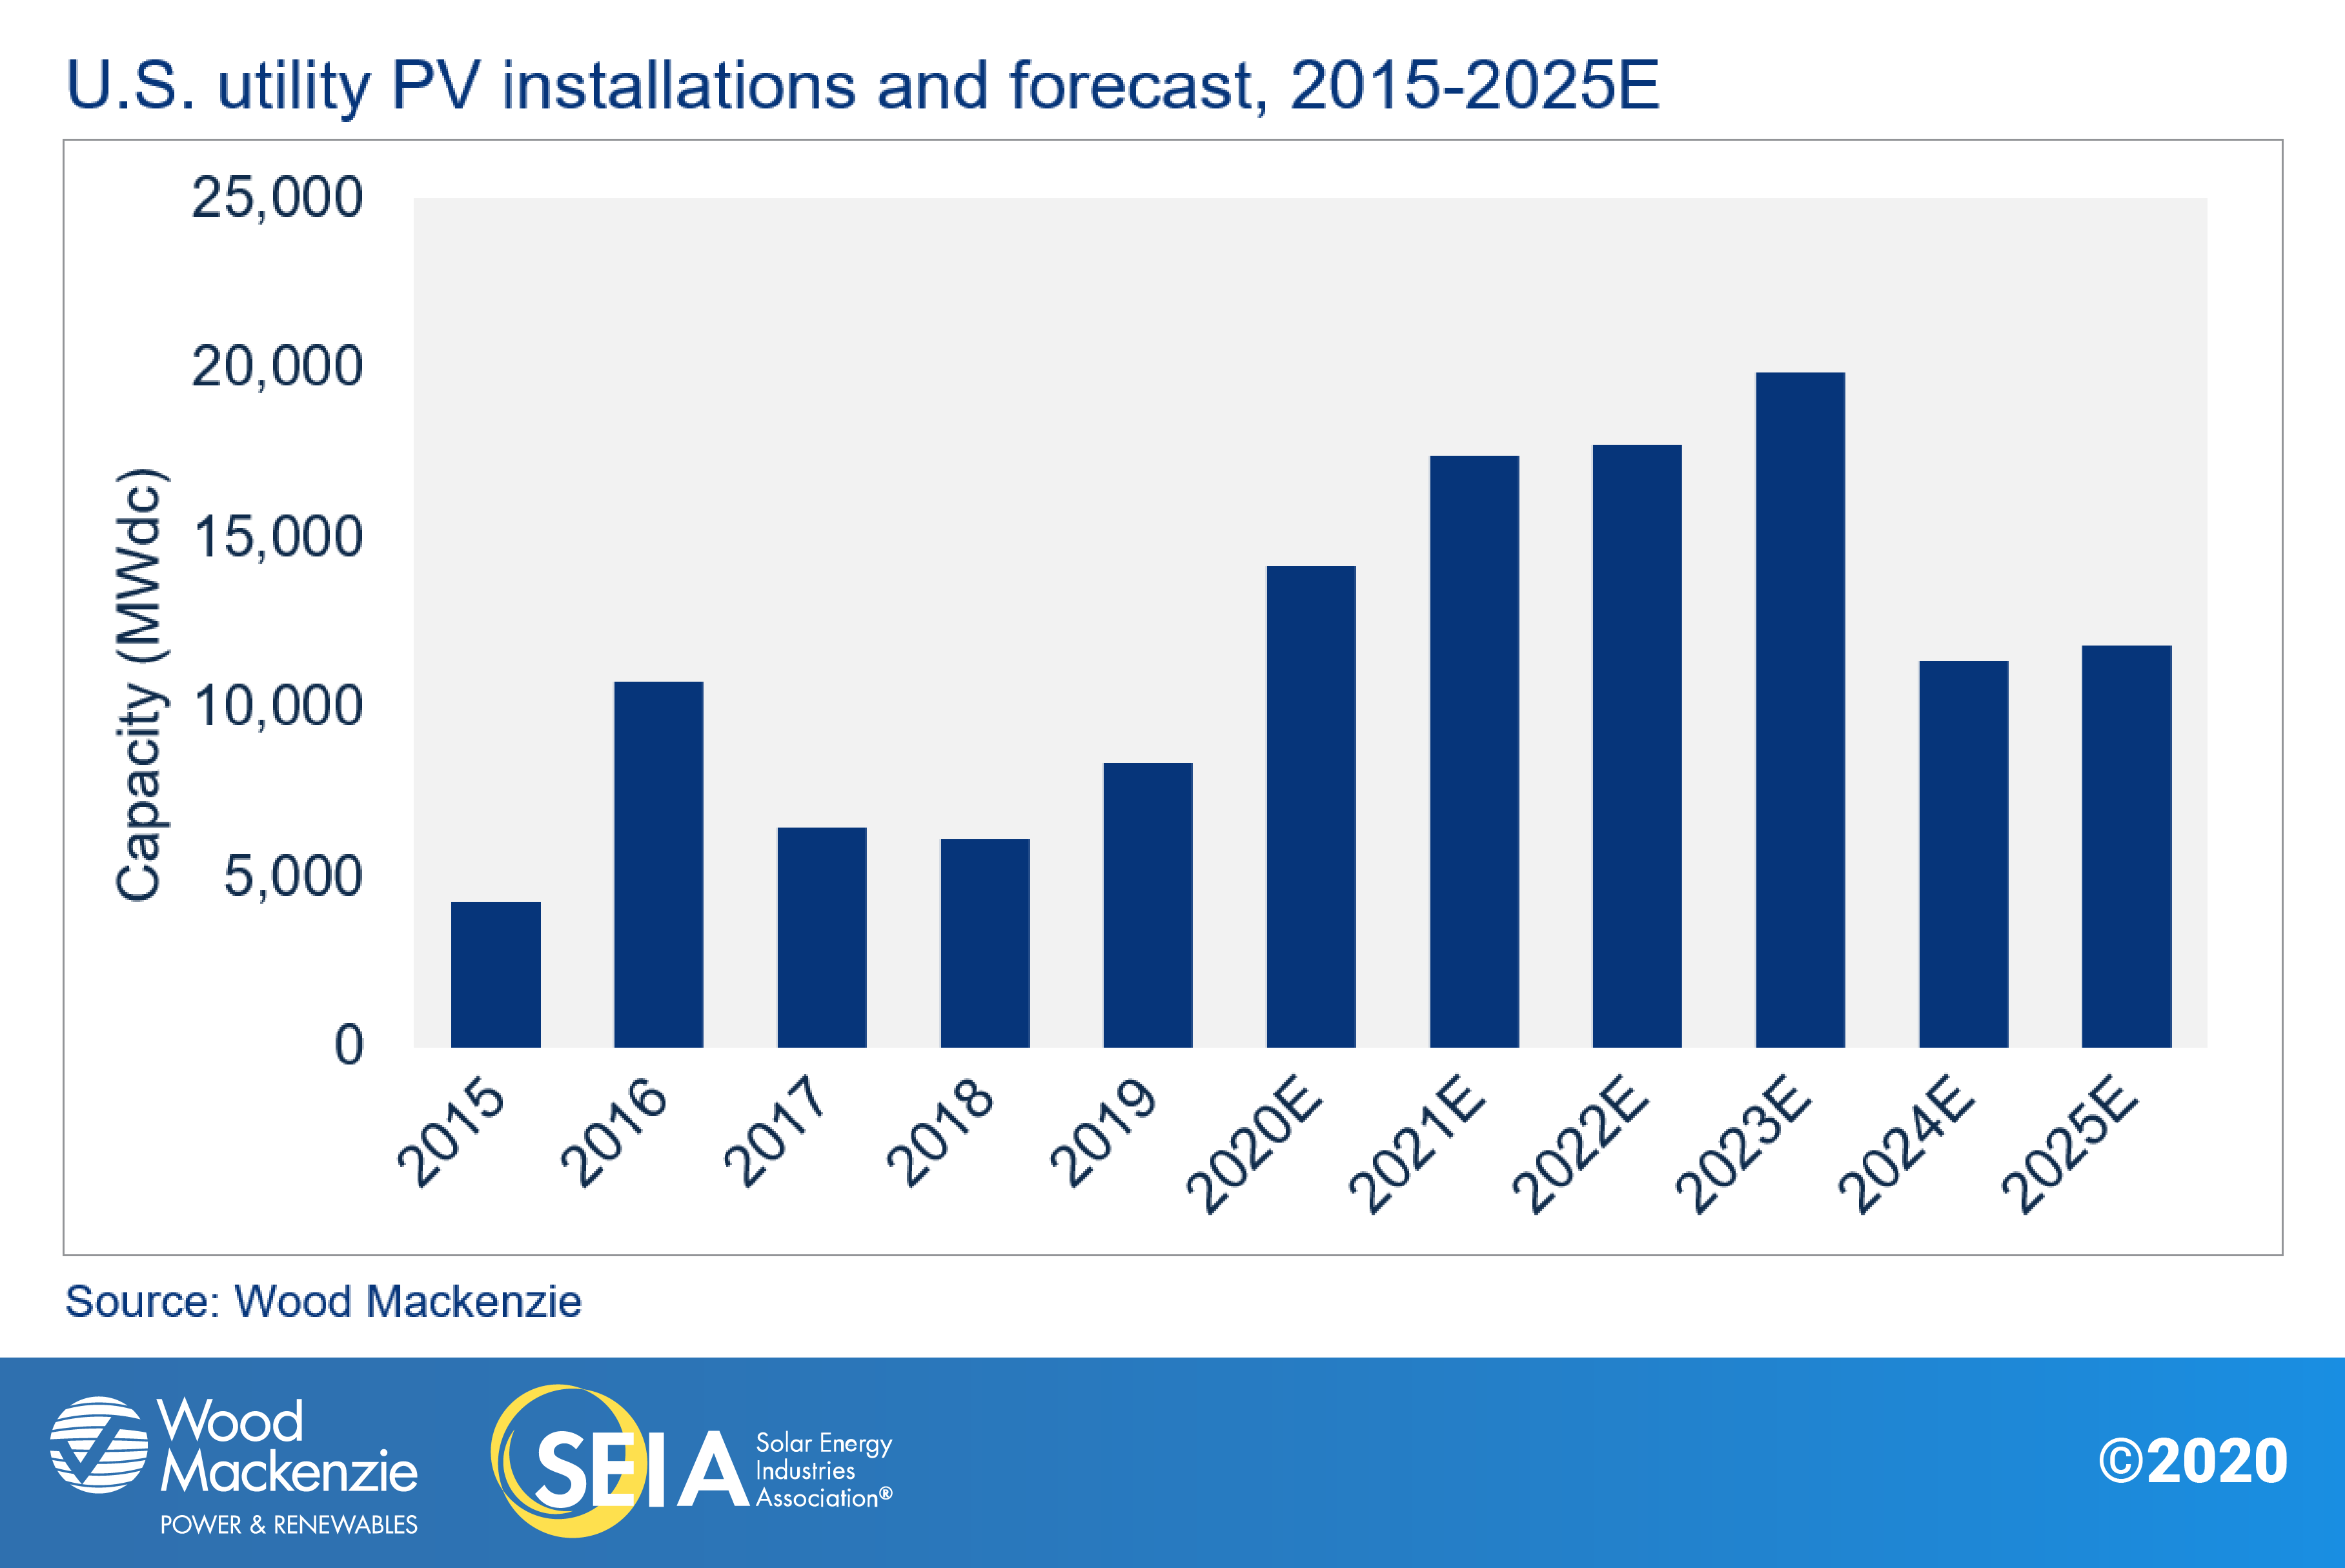
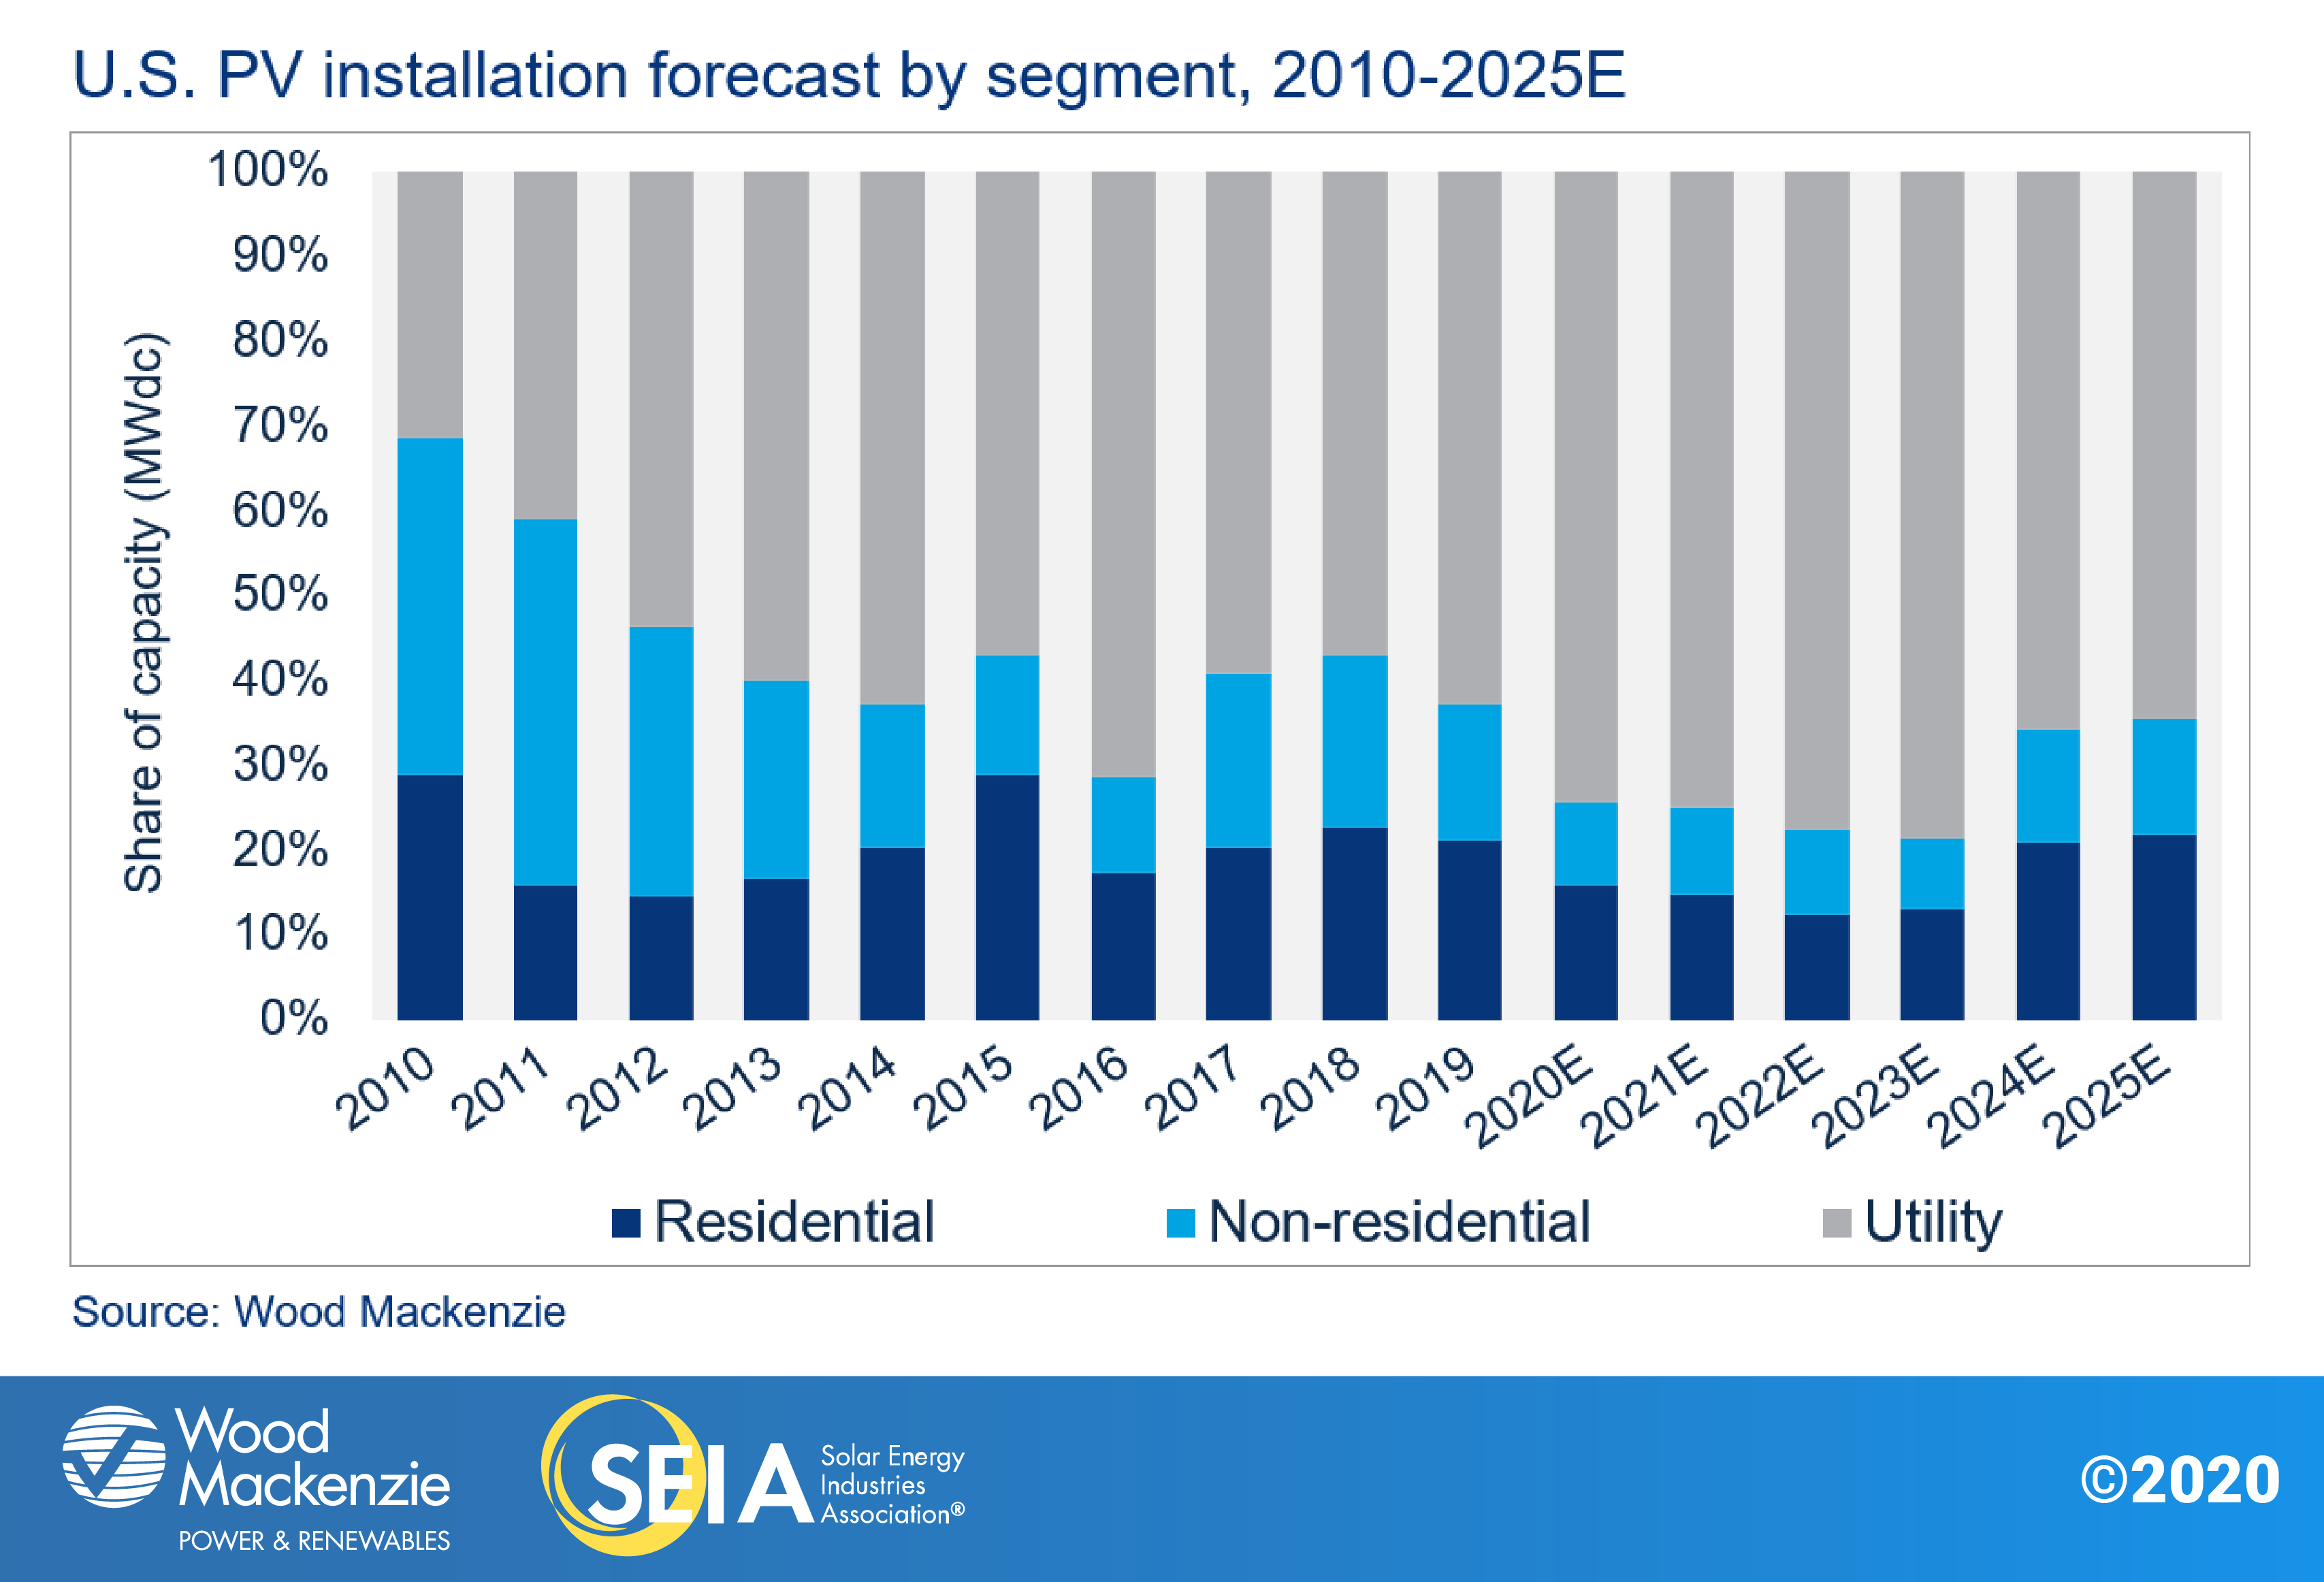
- There were 2.7 GWdc of utility-scale projects installed in Q3 2020, representing 70% of all solar capacity brought online this quarter. Utility solar has been only minimally impacted by Covid-19 related construction delays.
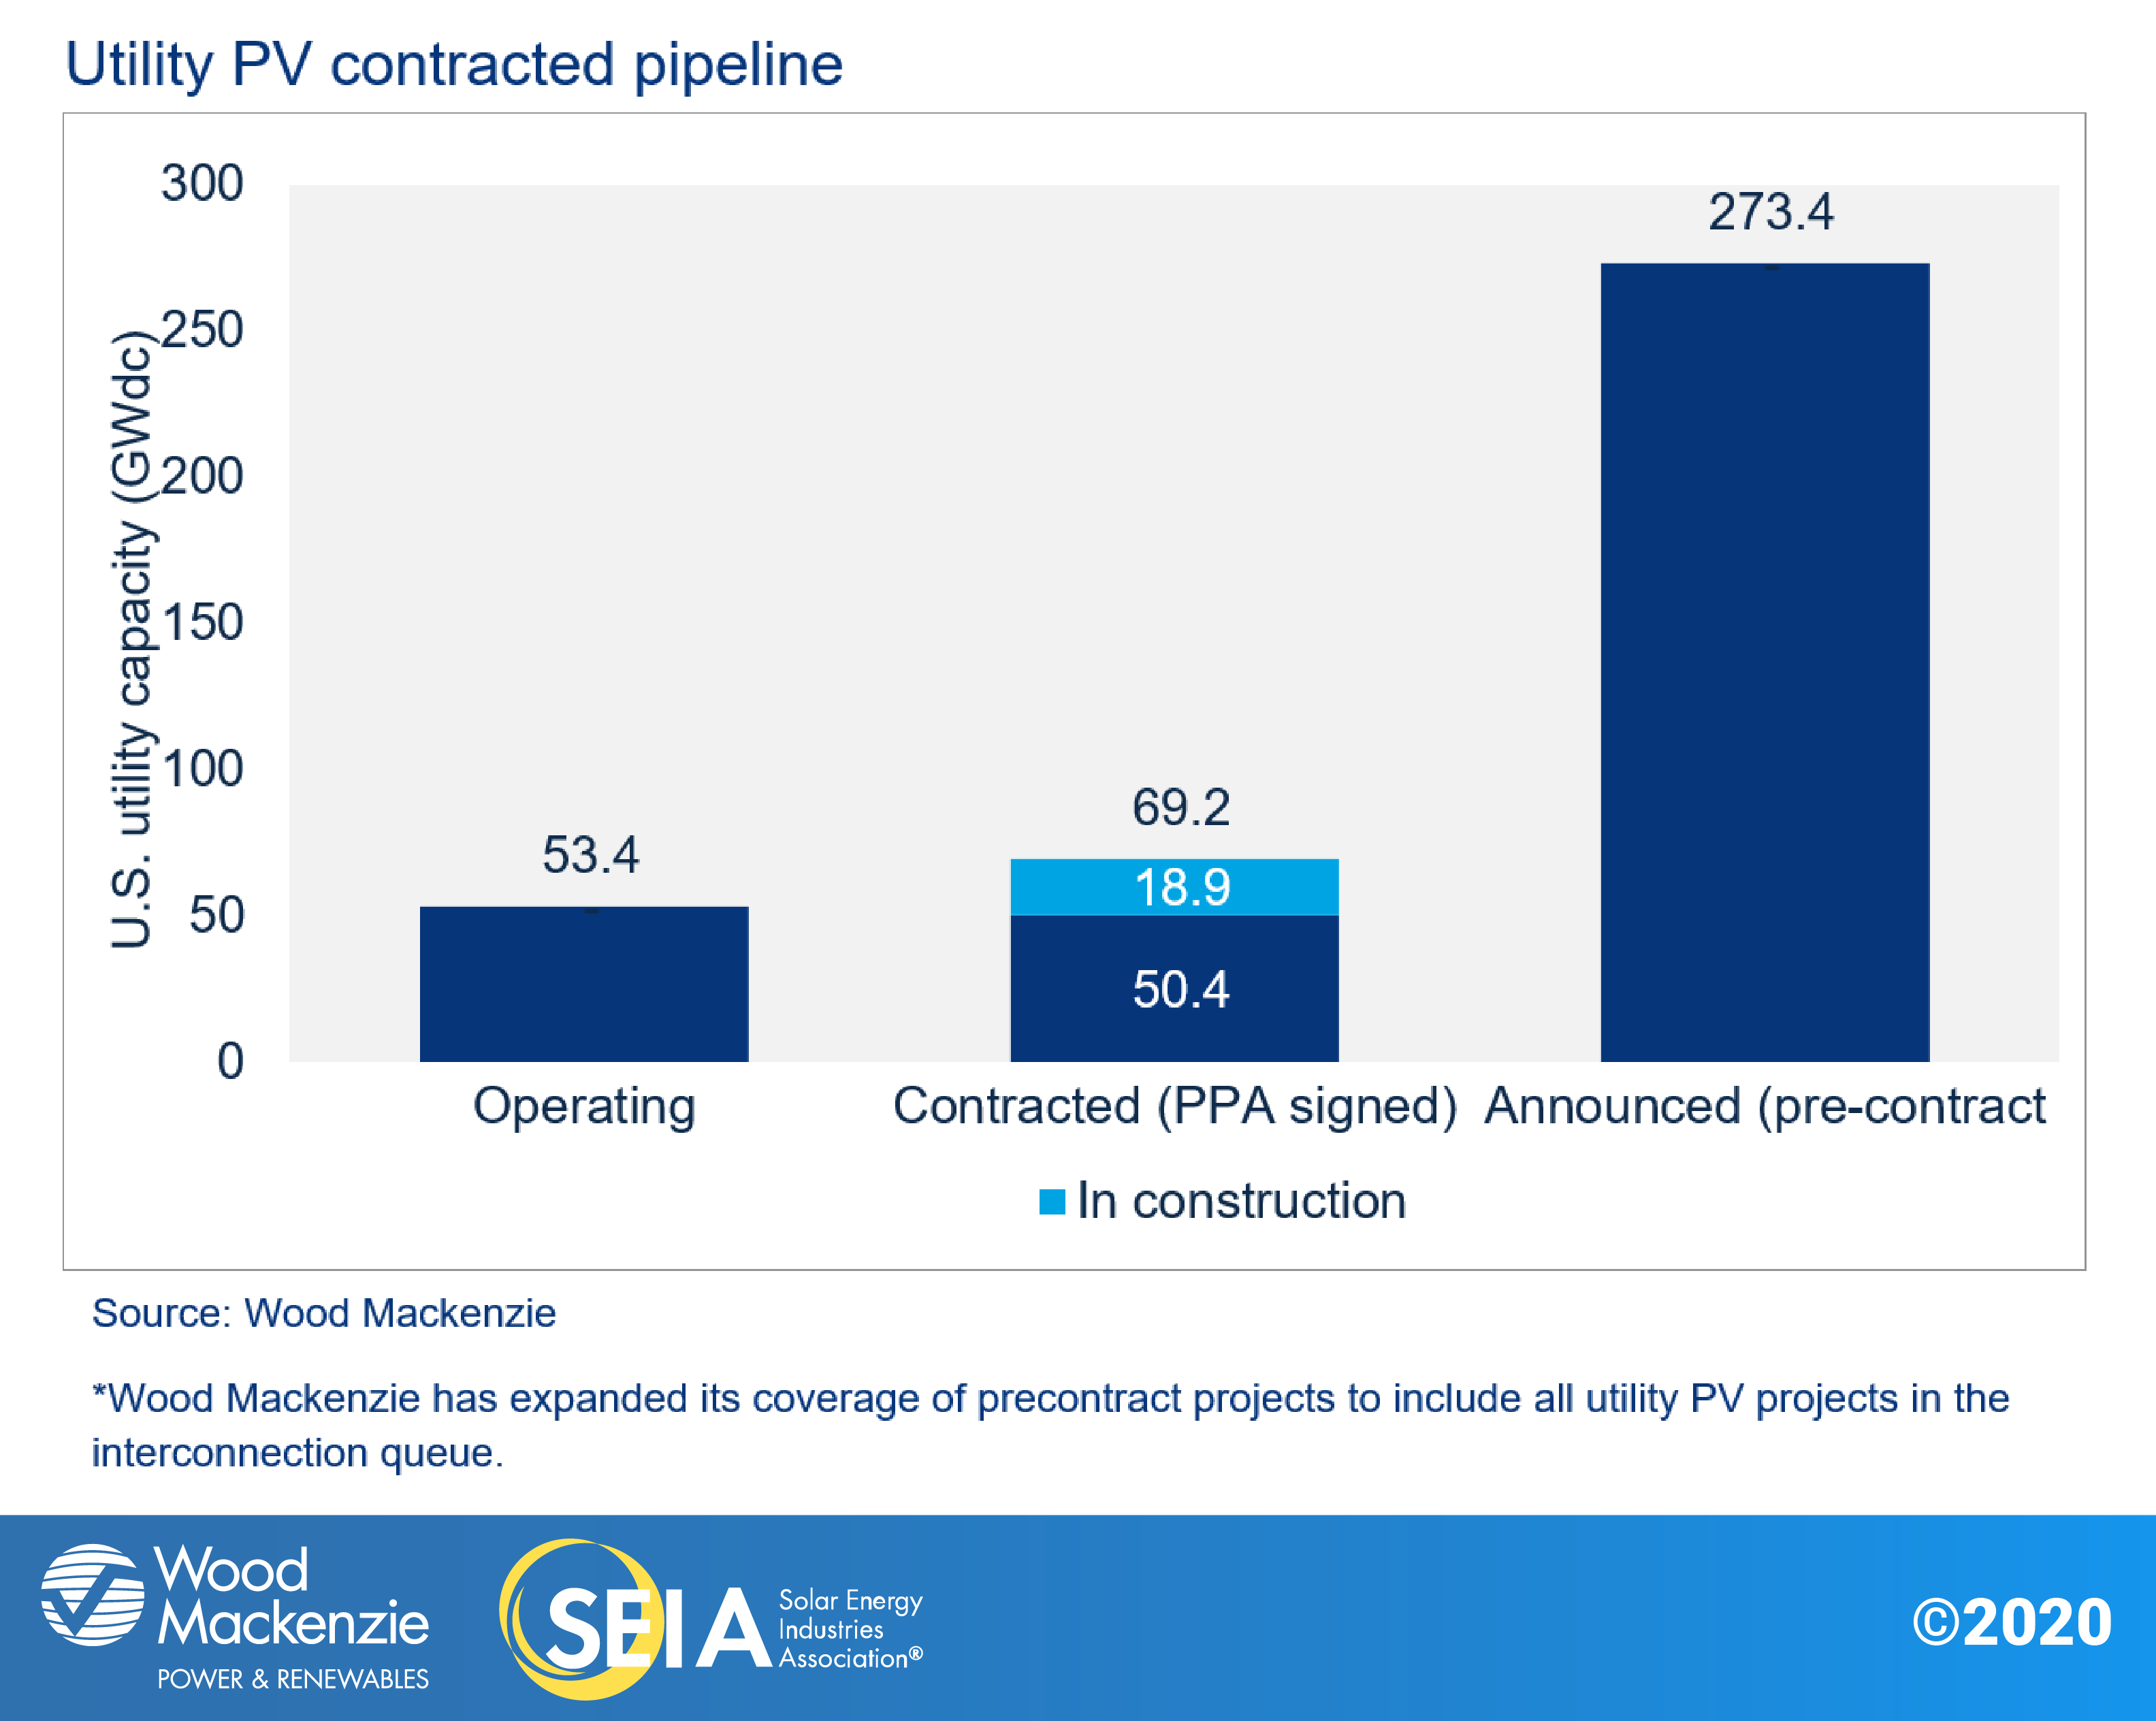
- A total of 9.5 GWdc of new utility PV power purchase agreements were announced in Q3 2020, bringing the contracted pipeline to a record total of 69 GWdc.
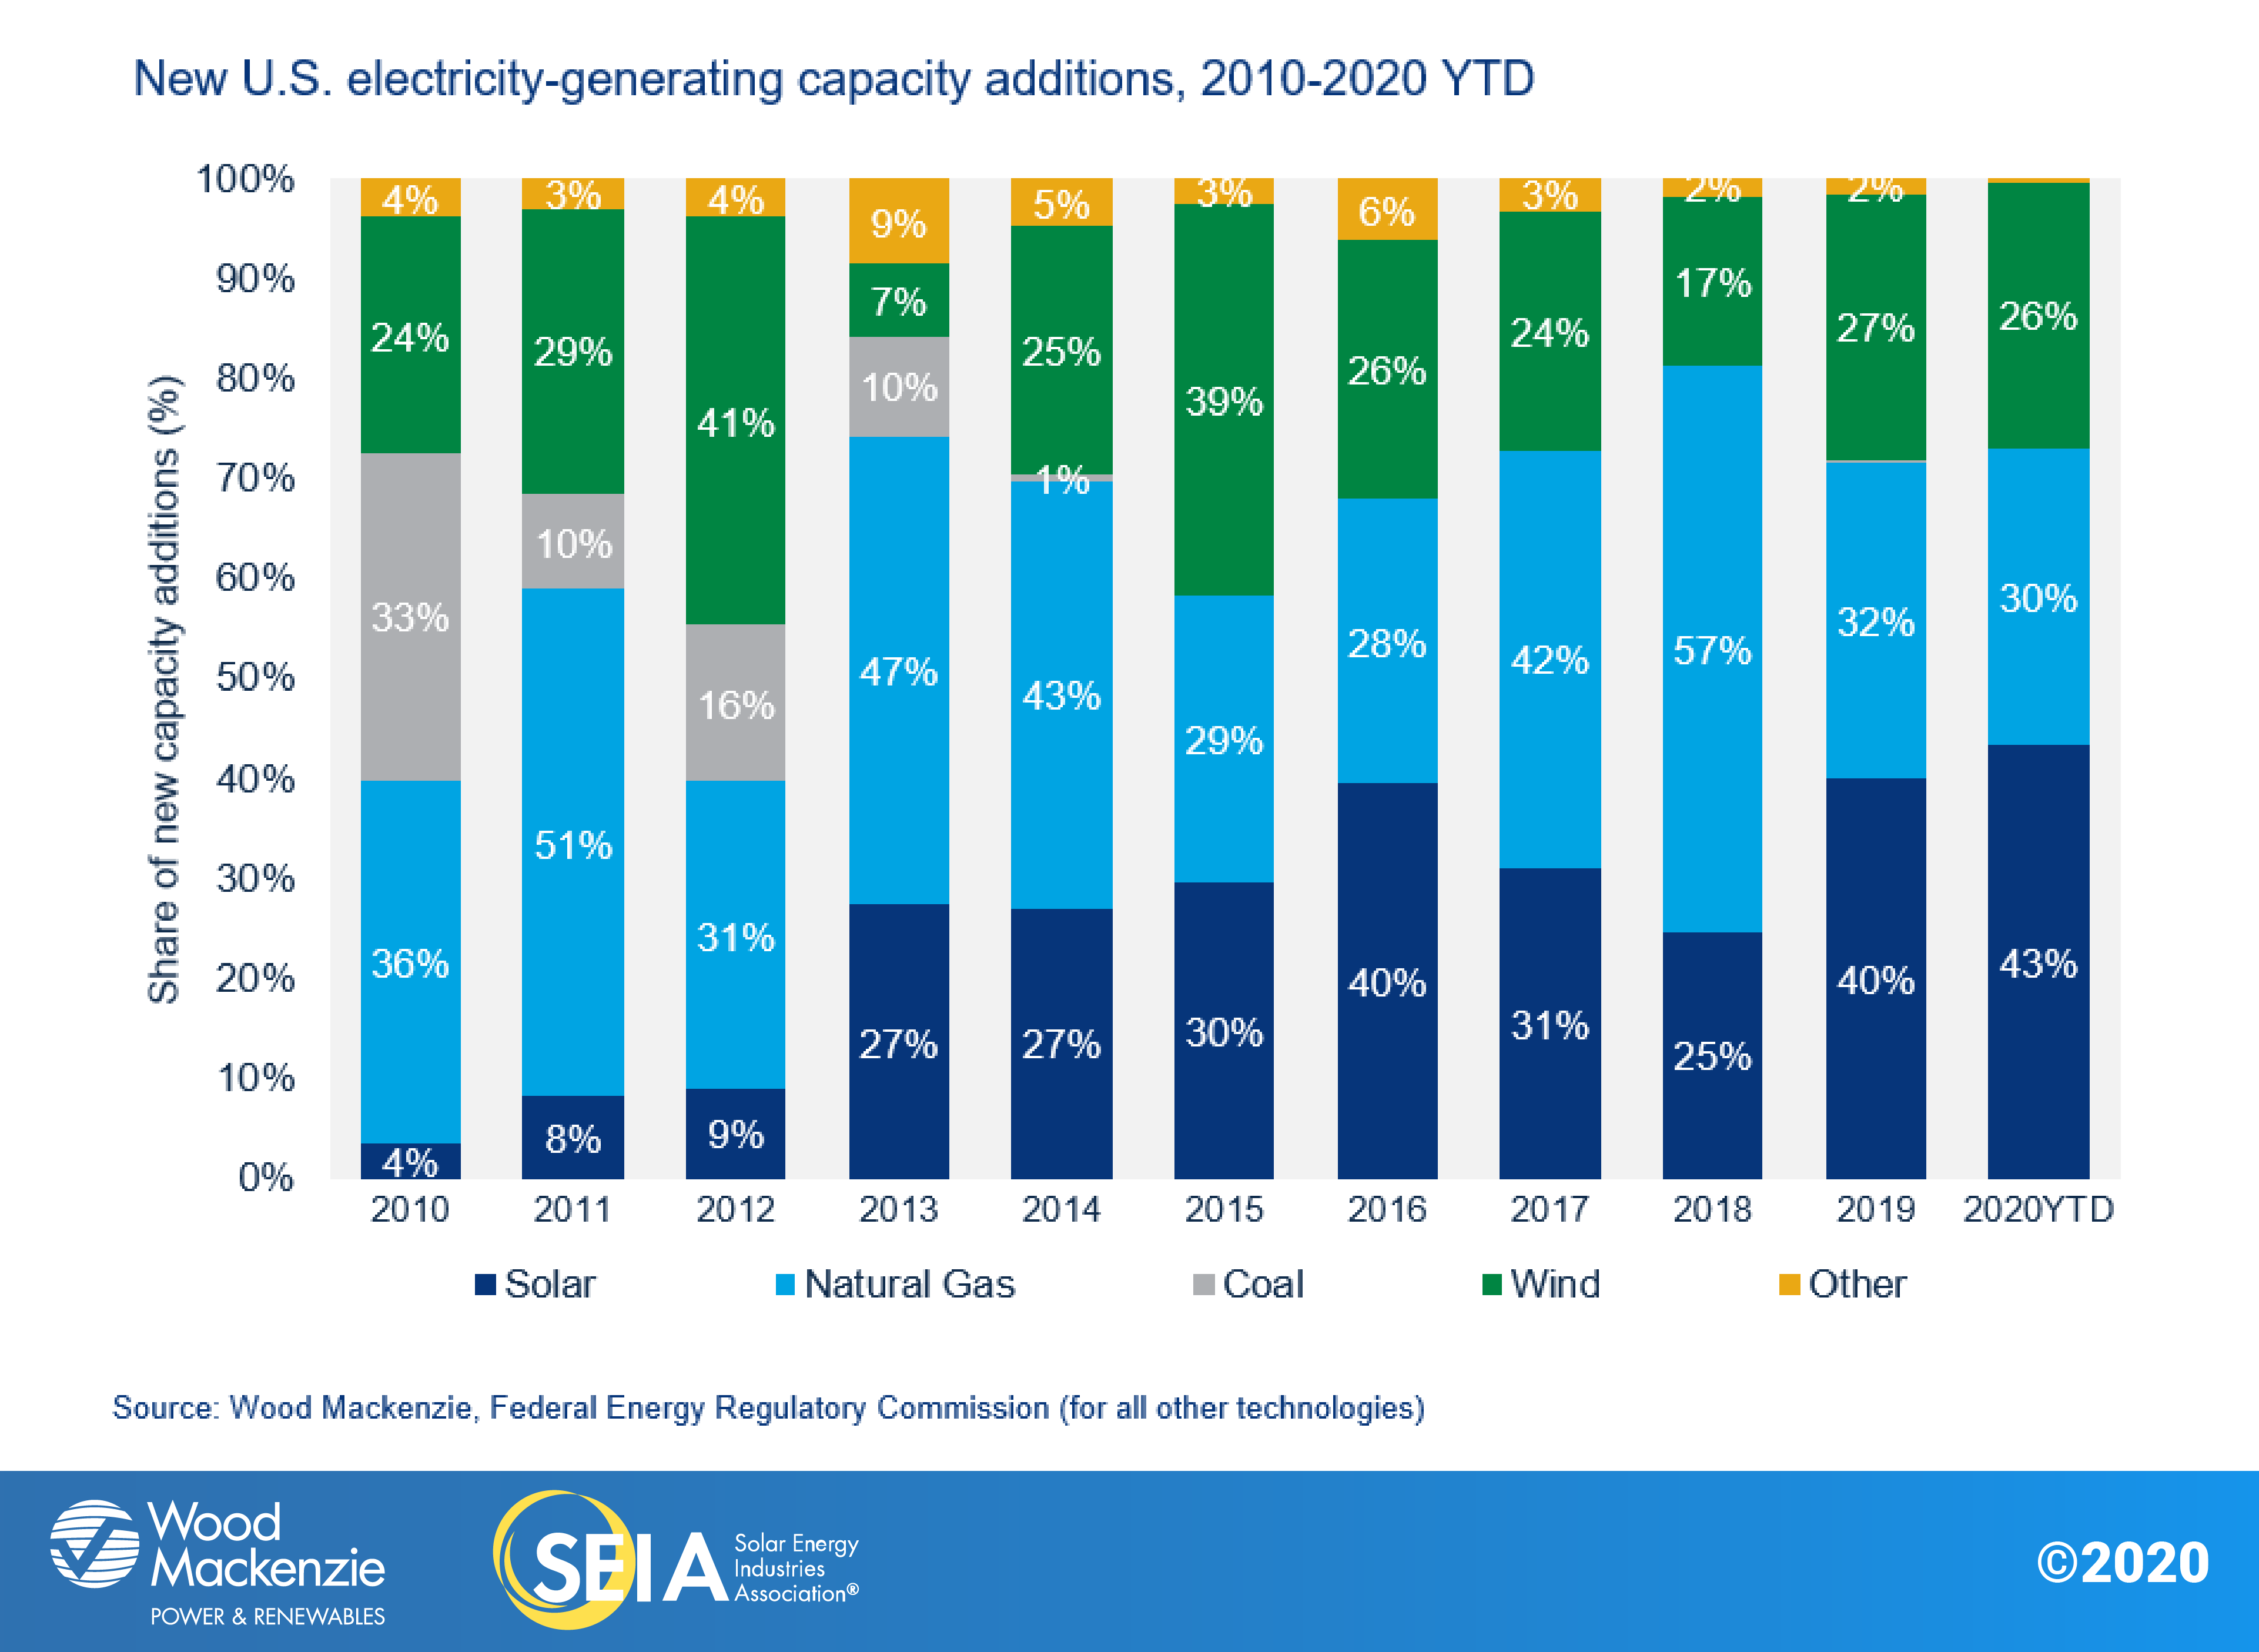
- Solar accounted for 43% of all new electricity generating capacity added in the U.S. through the third quarter this year, beating out all other generation technologies.
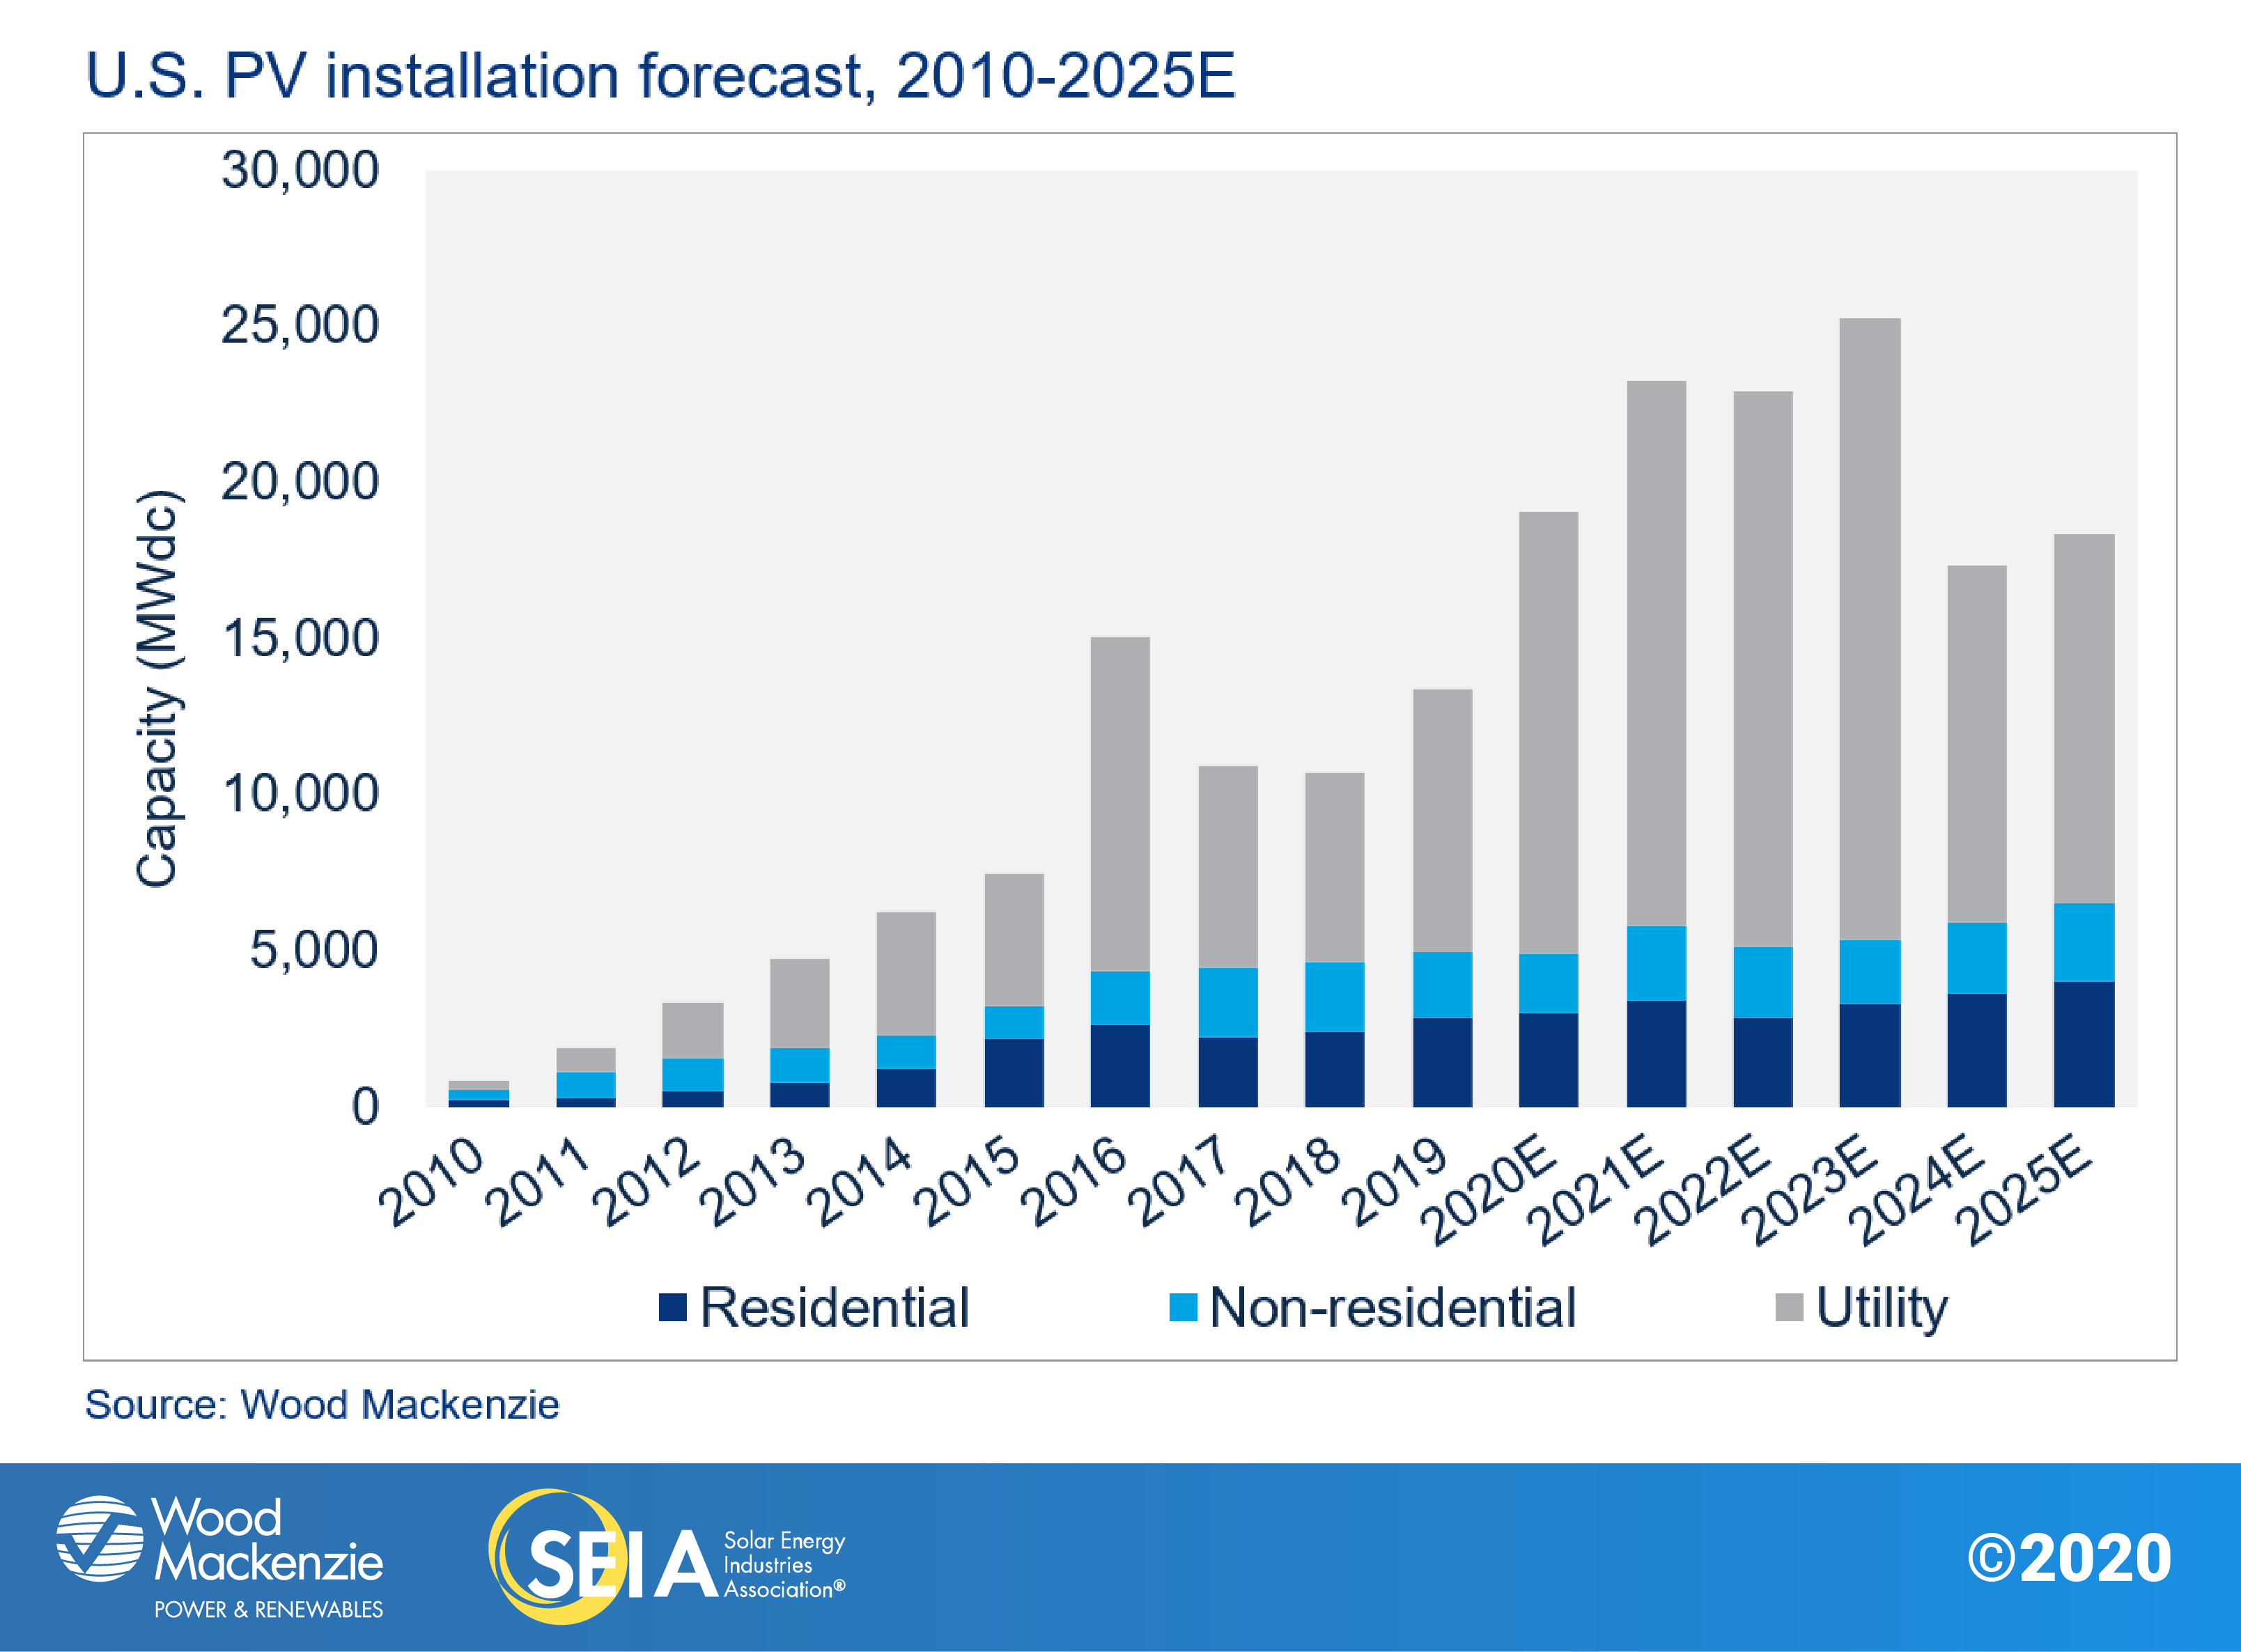
- Wood Mackenzie forecasts 43% annual growth for 2020, with more than 19 GWdc of installations expected by year-end. As quarterly volumes demonstrate more resilience to pandemic impacts than originally anticipated – with a faster-than-expected recovery for distributed solar – our outlook for the year has increased since last quarter.
- Solar Installations from 2021 – 2025 are now forecasted to exceed 107 GWdc, a 10 GWdc increase from last quarter driven primarily by increases to the utility-scale solar pipeline.
2. Introduction
In the third quarter of 2020, the solar industry continued to recover from the worst business impacts of the coronavirus pandemic. U.S. solar companies installed 3.8 gigawatts-direct current (GWdc) of solar photovoltaic (PV) capacity, a 9% increase quarter-over-quarter and a 46% increase year-over-year. Just under 70% of capacity installed in Q3 came from the utility segment, with 2.7 GW installed.
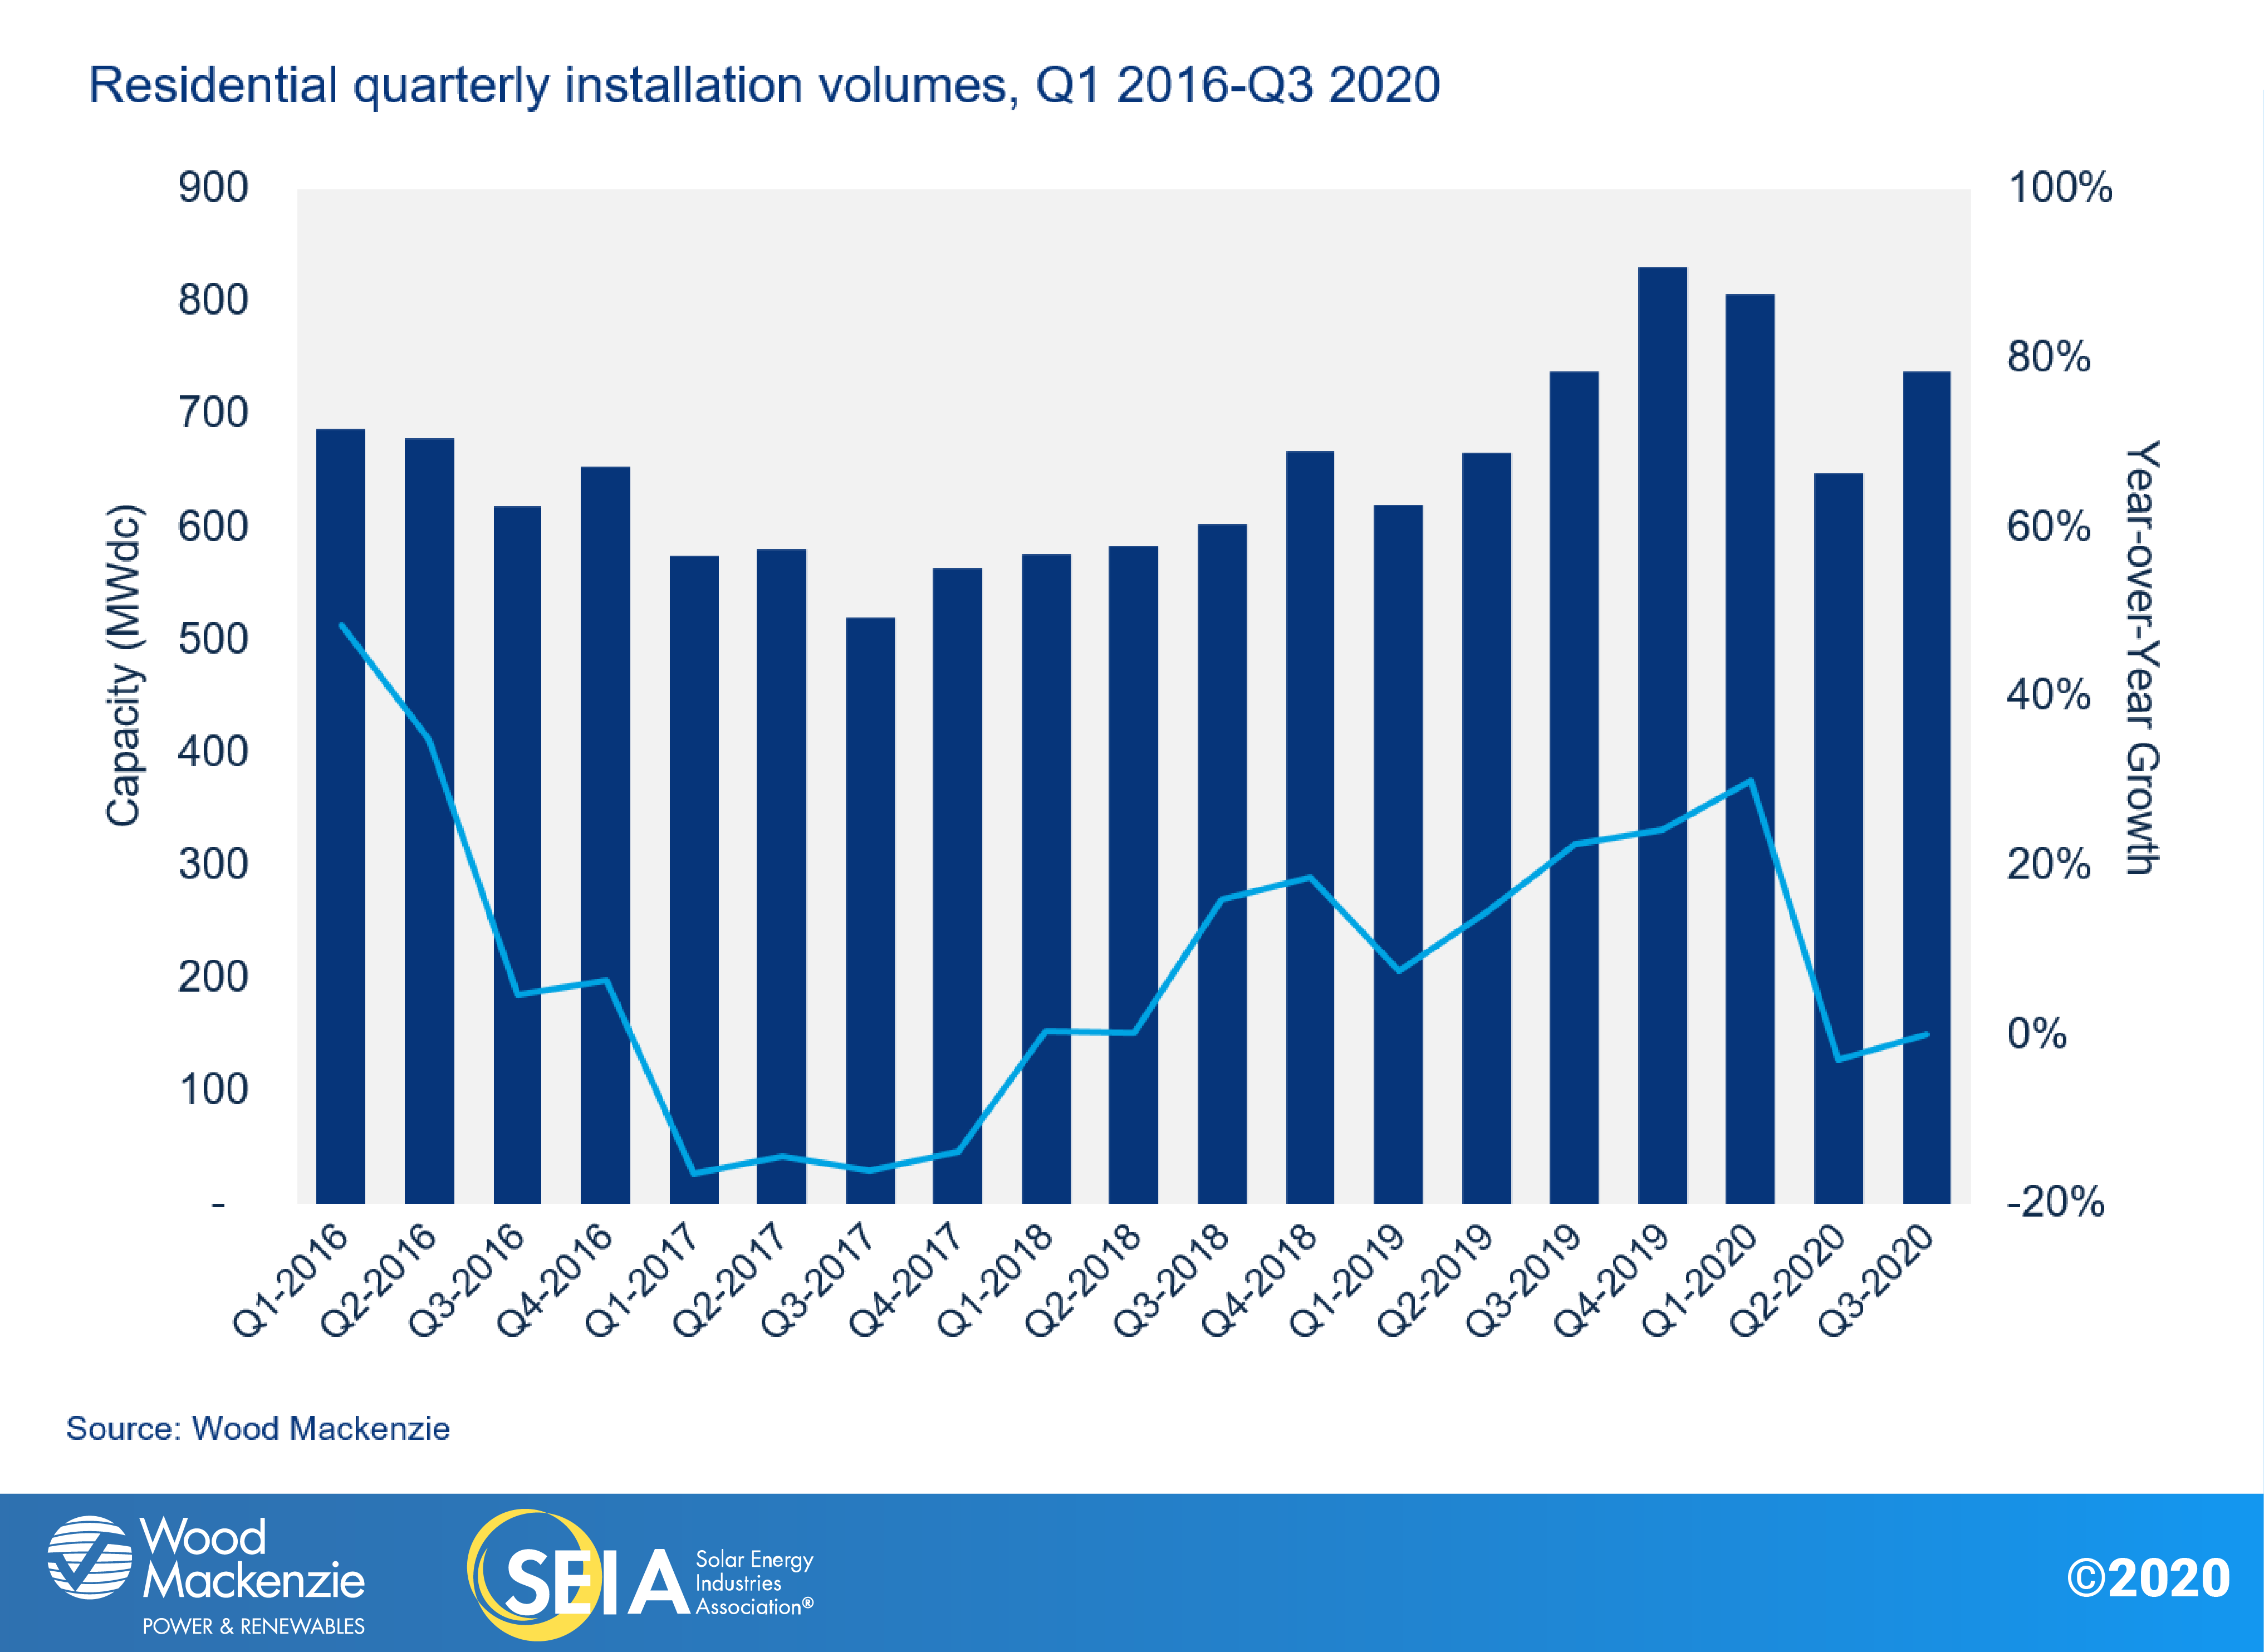
The residential market bore the brunt of the pandemic impacts to the solar industry in Q2 but experienced a relatively quick recovery with 738 MW installed in Q3, a 14% increase from the previous quarter (though still below pre-pandemic levels). The non-residential PV segment (which includes commercial, government, nonprofit and community solar) increased 8% from last quarter with 429 MW, in line with volumes for the first quarter of the year.
Despite setbacks from the pandemic, a record 11 GW of new solar capacity was installed in 2020 through Q3, already positioning 2020 as the third-largest year ever. Additionally, solar PV accounted for 43% of all new electricity-generating capacity additions through Q3 2020, the highest of any generation technology.
Residential solar growth and market confidence returns
The residential solar industry experienced some of its largest fluctuations in history over the last two quarters. Installation volumes in the second quarter decreased nearly 20% from Q1 – the most on record – as states mandated stay-at-home orders that impacted sales, permitting, installation and interconnection. The third quarter then achieved the highest mark for quarterly growth in the last four years (14%) as installation and sales activity returned. Many of the larger installers are reporting record sales volumes and project pipelines, though not every residential installer has recovered to the same extent.
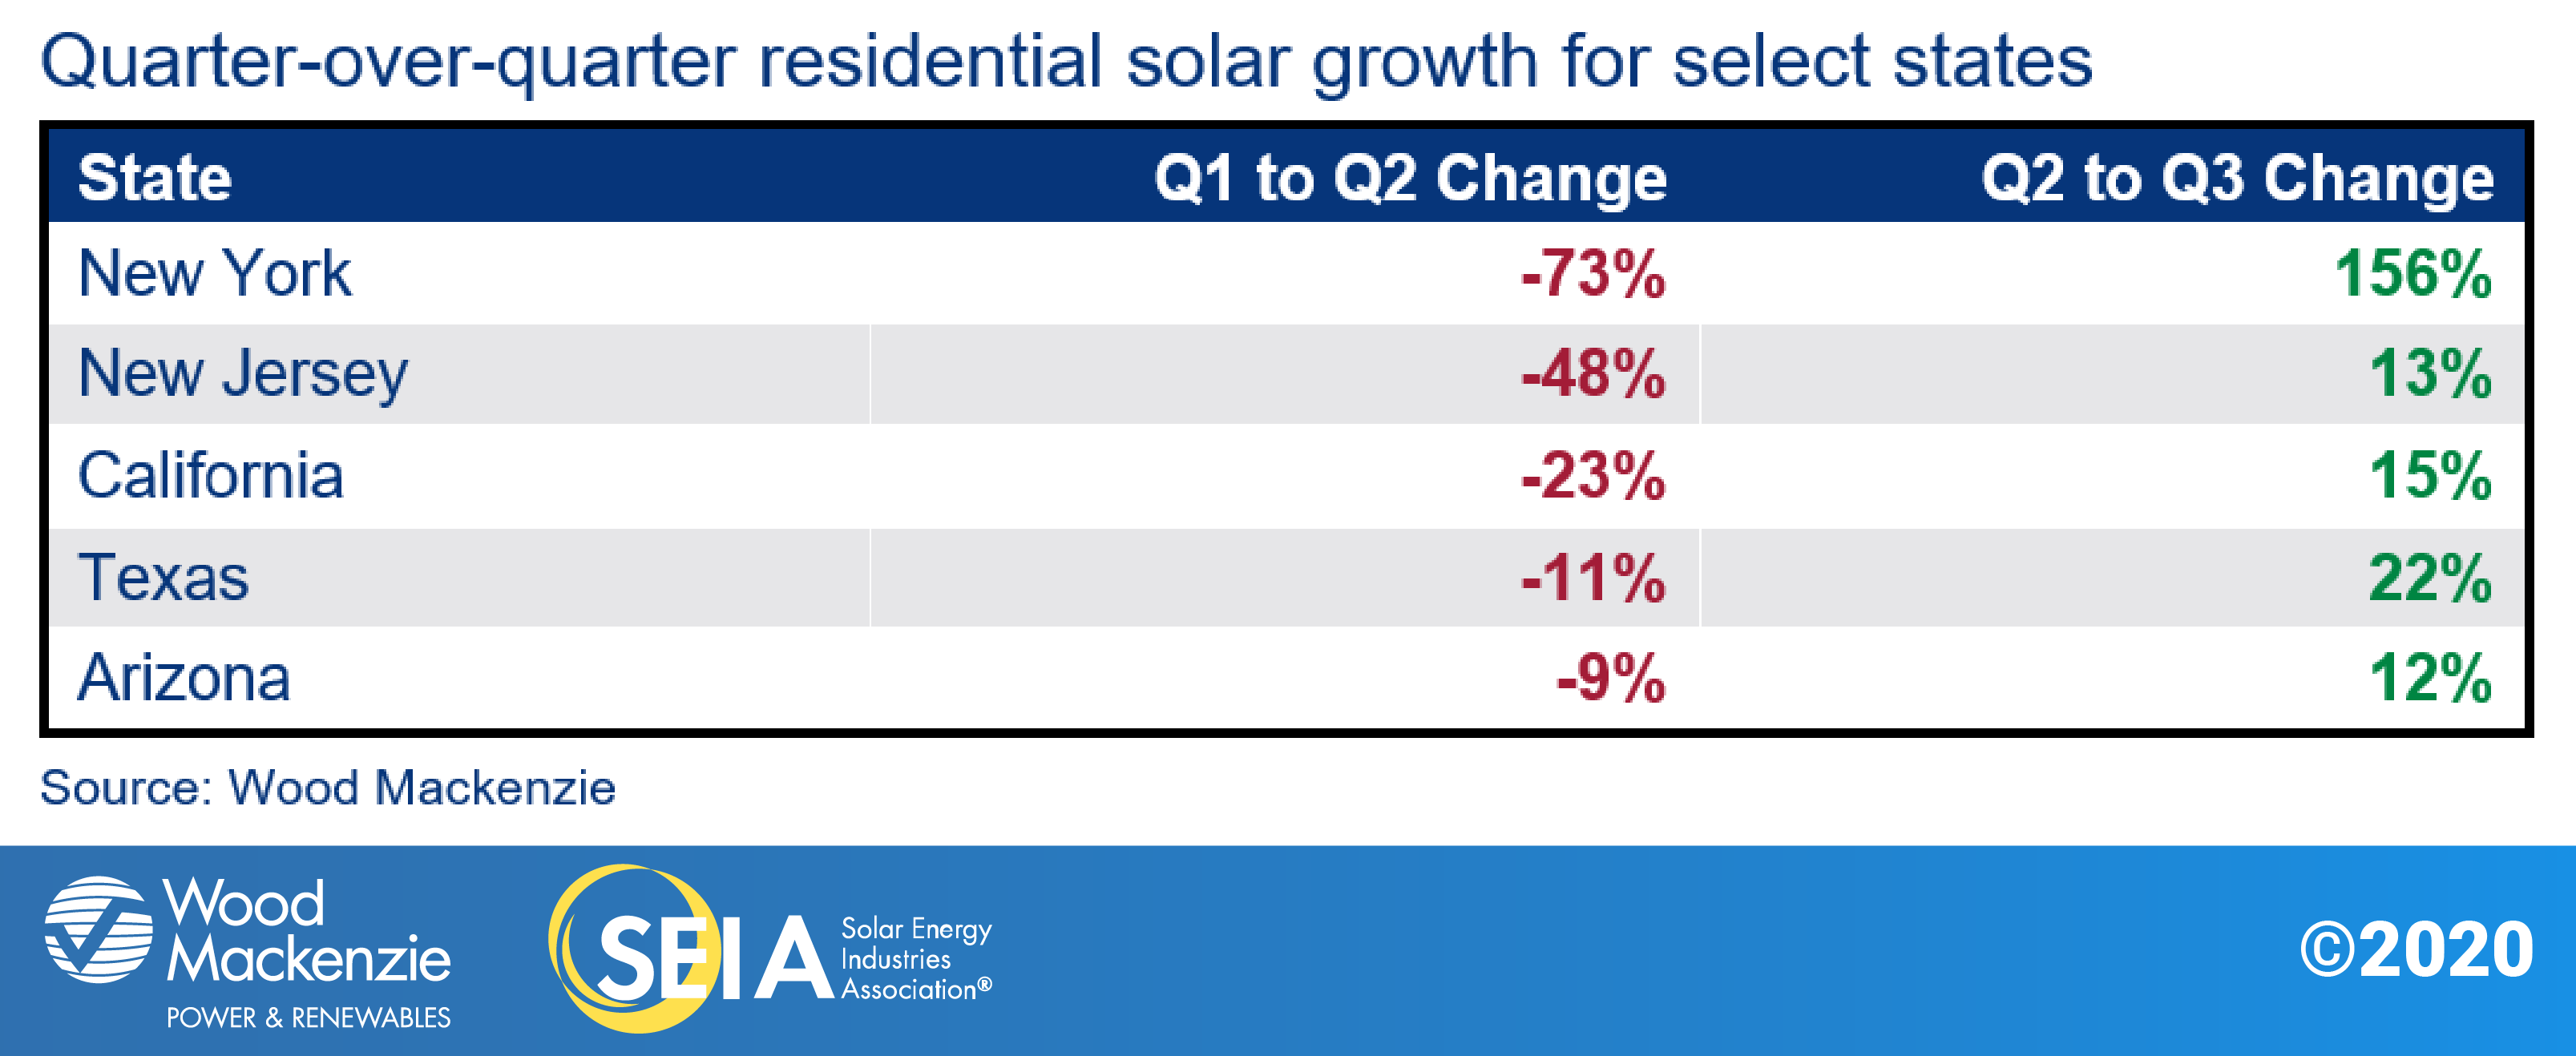
Logically, the states that saw the most dramatic declines have also seen the largest recoveries. California, the largest residential solar market, shrank 23% in the second quarter and grew 15% in the third quarter. New York, which had the strictest lockdowns, shrank 73% in the second quarter and rebounded with 156% growth in the third quarter. Markets like Arizona and Texas that put much less restrictive lockdown measures in place decreased slightly in the second quarter but each surpassed their first quarter volumes in the third quarter.
The innovations that many residential installers brought to their business models in Q2 continued to pay dividends through the summer and fall. Sales teams shifted to online and virtual sales techniques, which have proven successful for many companies. The increased adoption of online permitting processes and virtual meetings by cities and counties helped prevent further delays. Nearly every residential solar installer responded to second quarter declines by offering rebates or discounts, which has also helped to boost sales. Finally, residential solar growth continues to be supported by loan products with increasingly compelling customer economics. Loans with 25-year terms are starting to dominate sales. These loan terms allow for even lower monthly payments than previously popular product offerings.
For these reasons, the forecast for 2020 residential installations has increased to more than 3 GWdc, representing 7% growth over 2019. This is just shy of our outlook prior to the pandemic, demonstrating the resilience of the residential solar market.
Non-residential solar also recovers and pipelines grow in key state markets
In the third quarter, the non-residential solar market returned to first quarter levels with 429 MW installed. Growth returned in key state markets like California, Massachusetts, and New Jersey. Project development and construction activity picked up through the late summer and fall, and pipelines increased in growing state markets such as Maine, Virginia, and Illinois. Since installation volumes were healthier than expected, our 2020 non-residential outlook has increased by a few hundred megawatts.
Many projects are still on delayed timelines thanks to permitting and interconnection bottlenecks that occurred during the second quarter. This will result in a 26% increase to expected 2021 installations as projects spill over into next year and developers rush to qualify projects before the investment tax credit (ITC) drops to 10% in 2022.
Utility PV outlook grows rapidly amid rising state and utility targets
Confidence in the U.S. utility PV segment has surged back after several months of market uncertainty brought on by the coronavirus pandemic. The pandemic has no doubt created greater financial risk and precarious market conditions for developers, but the utility solar market has been able to weather these uncertainties so far and has continued to expand. Overall, the 2020-2025 forecast has increased by 8.6 GWdc. This increase is due to 9.5 GWdc of new project announcements in Q3 2020, a surge of new utilities announcing carbon reduction or renewable energy targets, and increased confidence in project buildout.
The pandemic has caused virtually no delays in utility project construction, with developers and EPCs reporting only minor non-pandemic related delays to this point. The pandemic has also caused little to no slowdown in new project announcements. By and large, utilities have continued ramping up solar procurement in anticipation of the ITC project completion deadline on December 31st, 2023. Procurement from C&I offtakers seems to be the only sector facing mild slowdown. New C&I offtake is expected to be down slightly from 2019 levels. Large corporations continue to sign agreements with developers, such as AT&T’s recent announcement of a 500 MWac PPA. However, small and medium corporations have expressed more hesitancy to procure renewable energy given uncertain market conditions.
Demand for utility solar has increased with many regions announcing higher renewable targets not only through state RPS policies but also from local utilities announcing solar procurement plans or carbon reduction targets. While utilities in states such as California, Colorado and Washington have announced carbon reduction targets as a means of aligning with state policies, several utilities are also pushing for targets above and beyond state policies. Combined with competitive economics, these new announcements will lead to growth in states like Arkansas, Indiana, Missouri and other states without favorable state-wide renewable energy policy.
Despite the renewed confidence in the market, there are some lingering risks. There continue to be fears of insufficient tax equity financing for all projects. While this does create downside risk, it is more likely that impacted projects will see delays instead of cancellations. Similarly, developers continue to report greater difficulty in securing EPC contracts for their projects. With so many developers looking for construction firms to complete projects before 2024, EPCs have reported being more selective about what projects they choose and favoring larger firms who can provide repeat business over smaller, less established developers.
Future pandemic lockdowns will have less impact
As Covid-19 caseloads continue to increase this fall, there is the possibility that more shelter-in-place orders will be implemented. But the industry is much better positioned to deal with future shutdowns, given the aforementioned adaptations. To have major impacts, future measures would have to be so restrictive that they limit even construction activities, like the NY PAUSE executive order. Such restrictions seem unlikely given the negative economic repercussions and the growing evidence that outdoor construction projects like solar installations can be undertaken relatively safely while observing public health guidance. Any future impacts from Covid-19 are more likely to stem from labor shortages due to the illness of employees or their family members, or parents needing to take care of their children while in-person school is not available.
Potential impacts of the election
While the incoming Biden administration has signaled an intention to deploy more solar, there are numerous political uncertainties that render quantitative market analysis too speculative at this point. Potential policies regarding tax credits, trade tariffs, decarbonisation targets, and research and development spending could meaningfully support solar market growth, but we cannot predict market outcomes without more clarity on the scope of any policy changes. More qualitative analysis on the impacts of the election are provided in the full report.
3. Market segment outlooks
3.1. Residential PV
Key figures
- 738 MWdc installed in Q3 2020
- Up 14% from Q2 2020
- Flat over Q3 2019
The recovery of the residential solar sector this quarter has improved our 2020 outlook, with installations now expected to grow 7% over 2019. Without significant restrictions on installation activity and adaptation to remote sales and permitting processes in many locations, many installers report that the market is returning to normal – and sales are growing.
As discussed in the previous report, the suppressed economy and higher unemployment levels this year have had less detrimental impacts on residential solar sales than originally expected. Sales volumes had returned to pre-Covid-19 levels by the middle of the summer, and ever since, many installers have had record-breaking sales months. While larger installers have recovered faster than smaller installers, the recovery has been broad.
As a result, the biggest limitation for the industry has shifted from sales to labor supply. Installation crews have been ramping back up and hiring more staff since the spring, but the labor supply is tight. The industry has now returned to the labor shortages experienced in late 2019 and early 2020 prior to the pandemic.
Labor shortages over the coming months will cause some projects to be delayed until next year. When combined with demand pull-in related to the ITC reduction in 2022, this will result in 13% growth in 2021 over 2020. Our 2021 outlook has been revised upwards for both Florida and Texas, where installers continue to report growing sales pipelines. Each of these markets is expected to install more than 300 MW in 2021, ranking behind only California.
Although the market will contract in 2022 in response to the ITC stepdown (to zero for direct ownership and to 10% for third-party-owned systems), growth will resume in 2023 and continue into 2025. Under current policy regimes, we expect longer-term growth of 10-15% between 2023 to 2025. This is contingent on improving economic fundamentals after the ITC has fully phased out, as well as continued geographic diversification outside of established state markets. It also depends on continued business model innovation for solar-plus-storage products, which will be increasingly important as states and utilities modify their residential solar compensation schemes. The degree to which President-elect Biden’s administration can enact their climate and energy agenda over the next several years offers significant upside potential to this forecast.
3.2. Non-residential PV
Key figures
- 429 MWdc installed in Q3 2020
- Up 8% over Q2 2020
- Down 13% from Q3 2019
Though the first half of 2020 was rocky for non-residential solar development, market conditions have improved in the latter half of the year. While there is still substantial inconsistency between local jurisdictions in shifting to online meetings and processes, for the most part developers have worked through these challenges and have been able to complete projects and grow their pipelines.
Another limitation for commercial solar this year has been securing tax equity financing. With an influx of solar projects requiring financing and general wariness from investors because of the current economic conditions, competition for tax equity financing has increased. Larger projects (>1 MW) with creditworthy offtakers won’t have a hard time finding willing financiers. But smaller projects, or those with non-investment-grade offtakers, may have to wait until more financing is available next year, or figure out alternative financing solutions.
The combination of project delays and demand pull-in from the ITC means that 2021 is expected to be a record-setting year at nearly 2.4 GWdc. Additionally, 42% of the non-residential solar outlook in 2021 is expected to be community solar (this share is expected to be 38% this year and was 29% in 2019). Several state programs – Massachusetts, Illinois, New Jersey, etc. – will be hitting their peaks next year.
Consequently, 2022 will see some slight contraction as the ITC phases down and lower origination volumes in 2020 manifest. While developers have reported that origination has picked up from the second quarter lull, overall origination in 2020 is still lower than it would have been prior to the pandemic. Many businesses have limited their expenditures on capital investments due to uncertain economic conditions.
The phase down of the ITC will continue to cause market contraction in 2023 as most qualified projects will have been built out in in the prior year. Additionally, many key state programs that support commercial solar will be ending or phasing down around this timeframe. Starting in 2024, market growth is expected to resume as solar costs decline and financing becomes more widely available.
3.3. Utility PV
Key figures
- 2.7 GWdc installed in Q3 2020, the largest third quarter for utility PV in history
- The utility PV contracted pipeline has grown by 7 GWdc to 69.2 GWdc
This quarter was the largest Q3 in history for utility PV with 2.7 GWdc deployed, bringing 2020 cumulative capacity to 7.6 GWdc through the end of Q3. The first nine months of 2020 were larger than the total capacity additions of any year except 2016 and 2019. Additionally, with 7 GWdc of projects expected to be completed by the end of December 2020 is on pace to exceed 2016 and become the largest ever year for utility PV. While some projects will inevitably spill over into 2021, we are confident that 2020 will exceed 14 GWdc.
With 25.9 GWdc of new utility-scale projects contracted in 2020 alone, the spectacular growth of the development pipeline has increased the forecast significantly. In addition to continued expansion of state-level renewable energy targets, many utilities have set their own targets in response to pressure from city governments and large corporate offtakers. Even before the country knew which candidate would be elected president, utilities viewed greater adoption of renewables as a hedge against possible climate action at the federal, state or local level. Along with pressure from cities, corporate offtakers, and grassroots organizations, these factors have led to several large utilities pledging to meet new carbon reduction or renewables targets.
Despite record installations and procurement, some potential downsides remain. As financial markets continue to experience uncertainty amid the pandemic, access to tax equity is becoming tighter for new entrants and smaller developers. Additionally, the capacity of qualified Tier-1 EPCs has not kept pace with the surge in procurement. Both factors primarily impact developers with small portfolios and are unlikely to lead to cancellations but could cause some delays for projects looking to come online between 2021 and 2023.
With construction of the current utlity PV pipeline remaining on track and 6 – 10 GWdc of new projects announced each quarter this year, our five-year forecast has grown considerably to match the rise in solar demand. The 2020-2023 forecast has grown by 9.8 GWdc while the 2024-2025 forecast has shrunk by 1.2 GWdc.
Near term, our 2020 forecast has been increased modestly to 14.2 GWdc as we grow more confident in projects reaching completion before the end of the year. The 2021 and 2022 forecasts have grown by a cumulative 5.5 GWdc. With more than two thirds of new project announcements targeting these two years, we have grown more confident that 2021 and 2022 will see robust growth.
Our outlook for 2023 has seen an 18% increase to 19.4 GWdc. There are two main factors contributing to this increase. First, the push by developers to complete ITC-qualified projects by 2023 will create the largest single year on record. There are already 12.8 GWdc of projects announced with 2023 completion dates. As more PPAs are signed, we expect the 2023 development pipeline to continue to swell.
Spillover from 2023 to 2024 poses a much greater financial penalty than in previous years due to the ITC project completion deadline, so developers will seek to build as many projects as possible before the ITC drops to 10%. Second, projects that need to begin delivering power in 2024 are being pulled into 2023 to take advantage of the ITC. Some developers are already planning to bring projects online in 2023 that do not require power delivery until 2024.
The 2023 demand pull-in has reduced our 2024 and 2025 forecasts to 11.1 and 11.4 GWdc respectively. To be clear, the forecast reduction in those years is not indicative of a reduction in demand but instead a shift due to financial considerations on the part of developers and owners. Indeed, with increasing utility-driven renewable energy goals, declining prices in utility-scale storage, the potential for impactful federal or state action on climate and growing interest among corporates for large-scale renewables, there is considerable upside to our forecast for the middle part of this decade.
4. U.S. solar PV forecasts
5. National solar PV system pricing
We employ a bottom-up modeling methodology to capture, track and report national average PV system pricing for the major market segments. Our bottom-up methodology is based on the tracked wholesale pricing of major solar components and data collected from multiple interviews with industry stakeholders. Due to increased demand for mono PERC solar modules, we report a weighted average of multi-silicon and mono PERC solar modules for the residential and non-residential segments as opposed to pricing for multi-silicon modules only. Q4 2019 is the first quarter in which these new blended system prices were applied, so previous quarters for the non-residential and utility sectors will not be commensurable with Q4 2019 and onward. Mono PERC solar modules are more expensive than multi-silicon modules, so the new blended module price methodology will yield higher system prices.
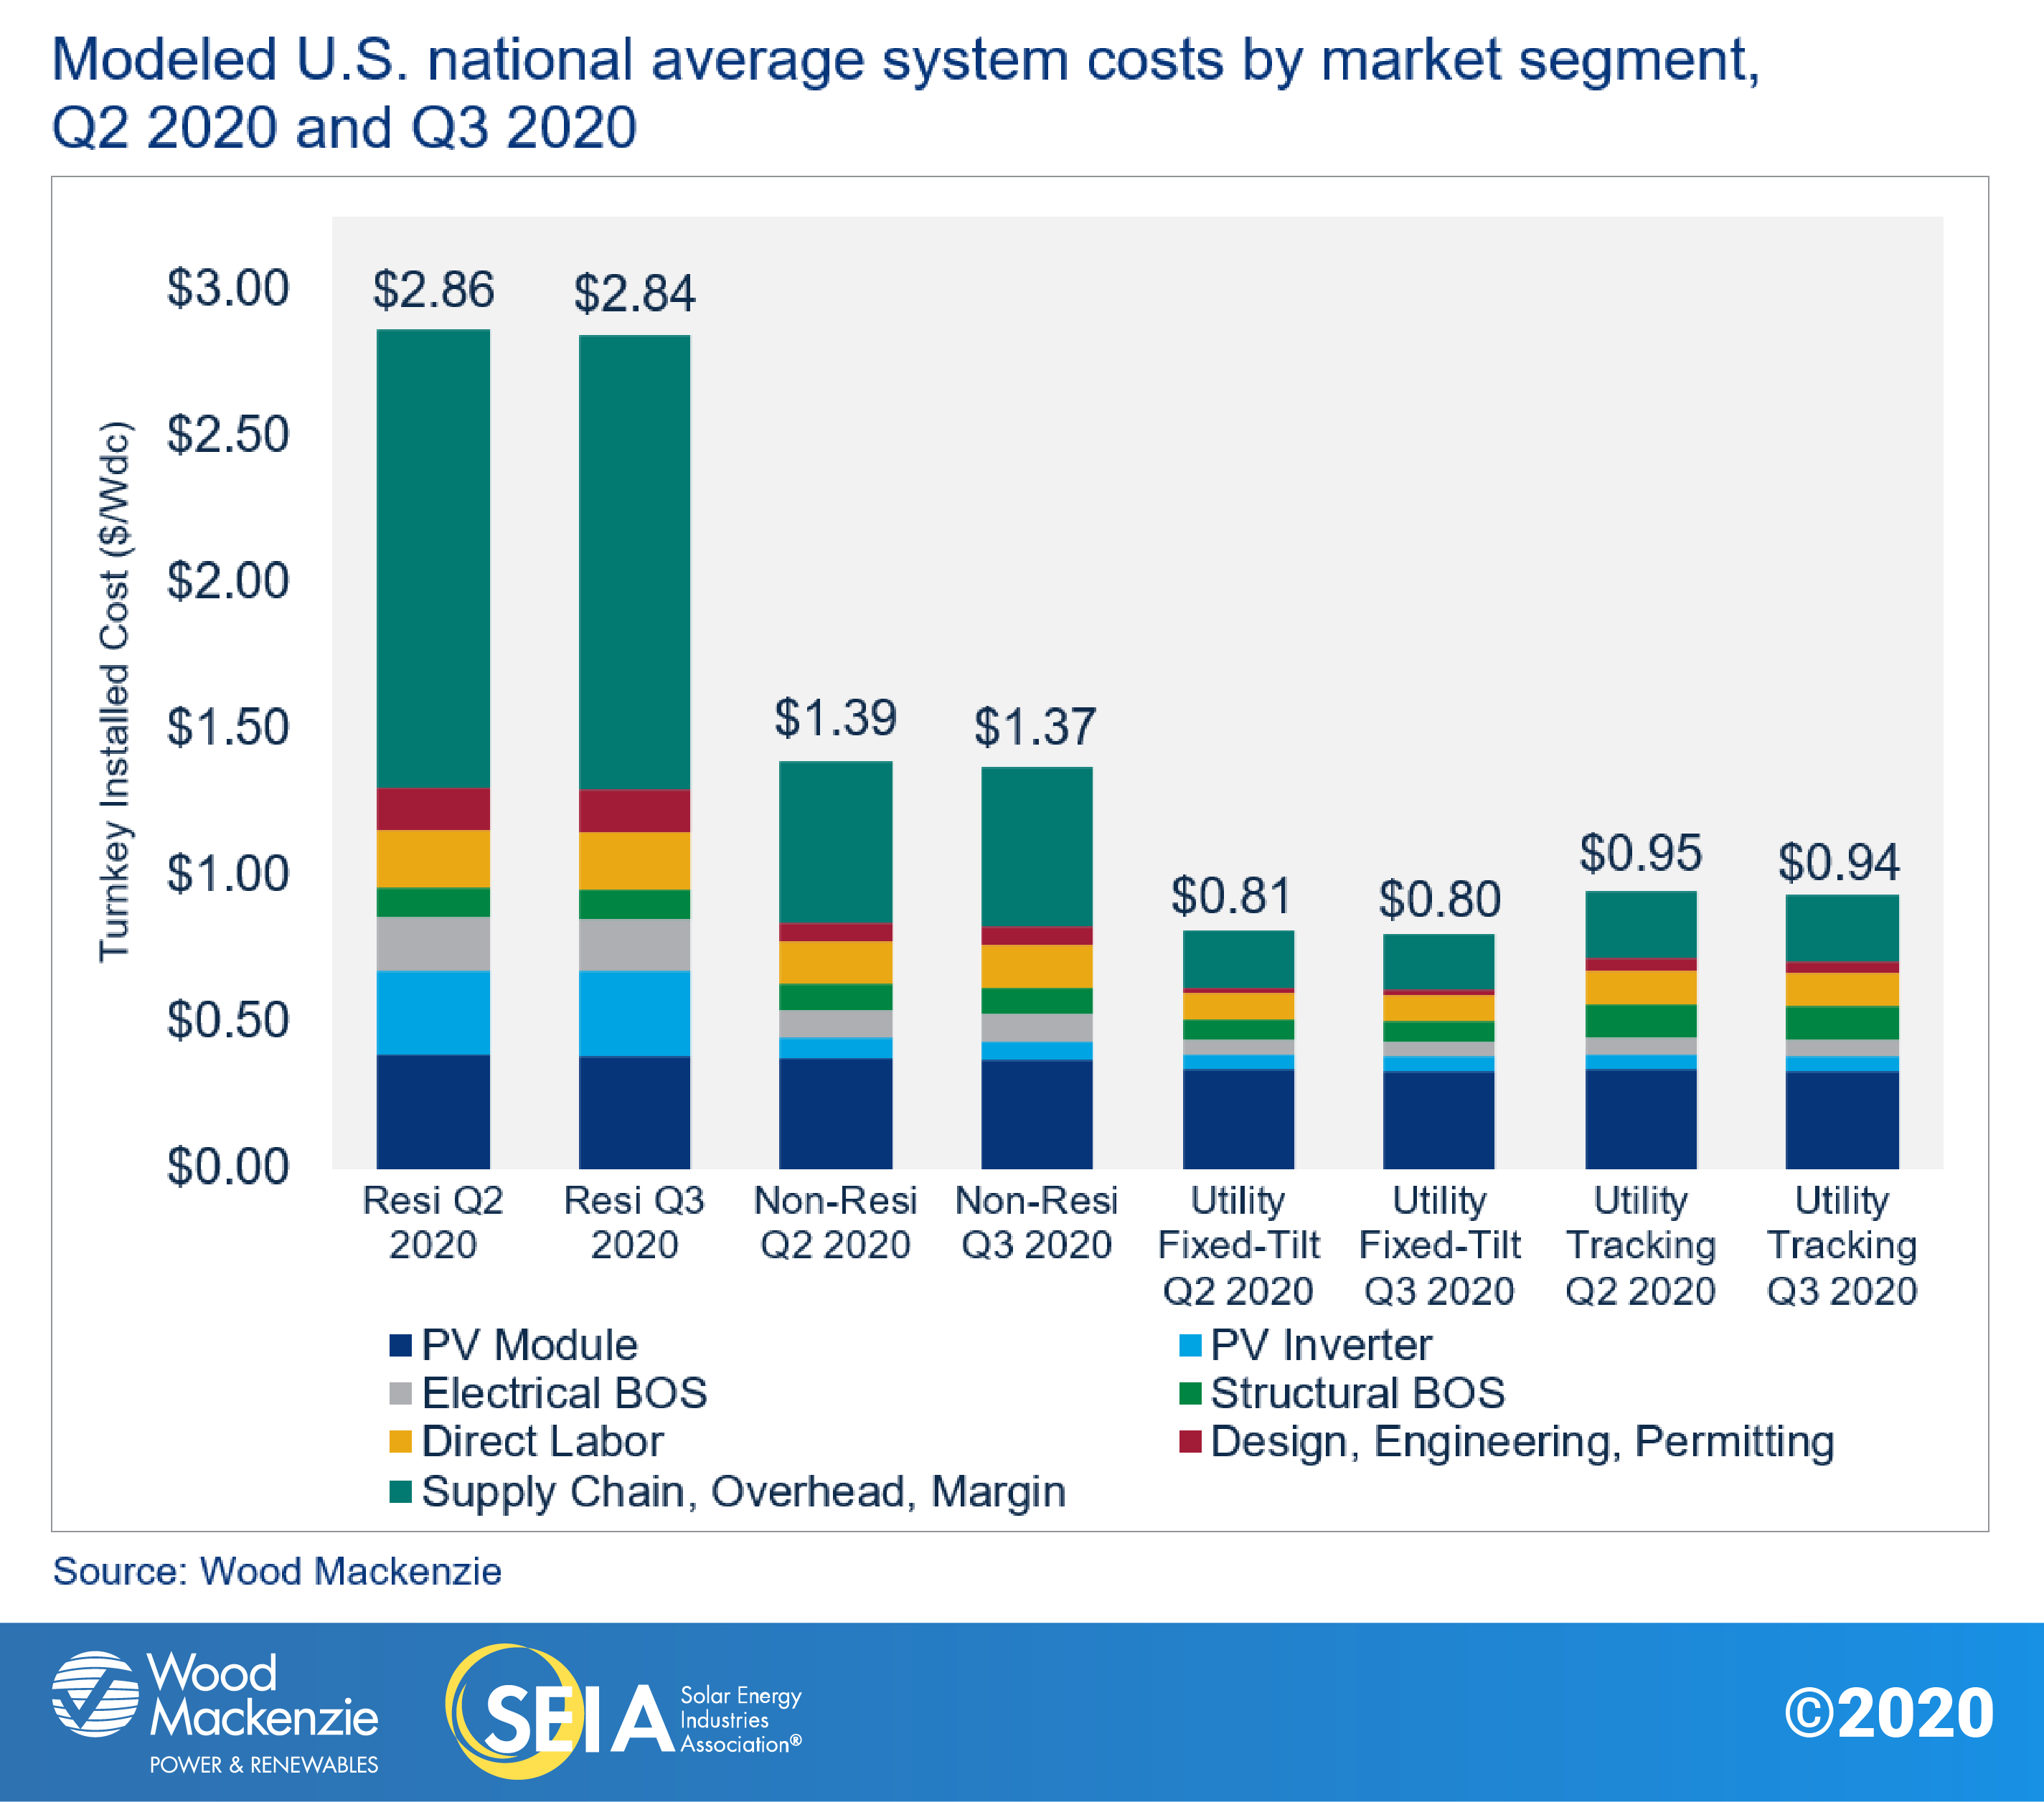
In Q3 2020, system pricing fell across all market segments. System pricing fell quarter-over-quarter by 0.7%, 1.4%, 1.3% and 1.2% in the residential, non-residential, utility fixed-tilt and utility single-axis tracking markets, respectively. The impact of Covid-19 on utility-scale soft costs remains minimal, despite delays caused by permitting processes and scheduling of labor. For distributed solar, the true impact on system costs is still not fully known as companies continue to adopt to virtual sales strategies.
6. Component pricing
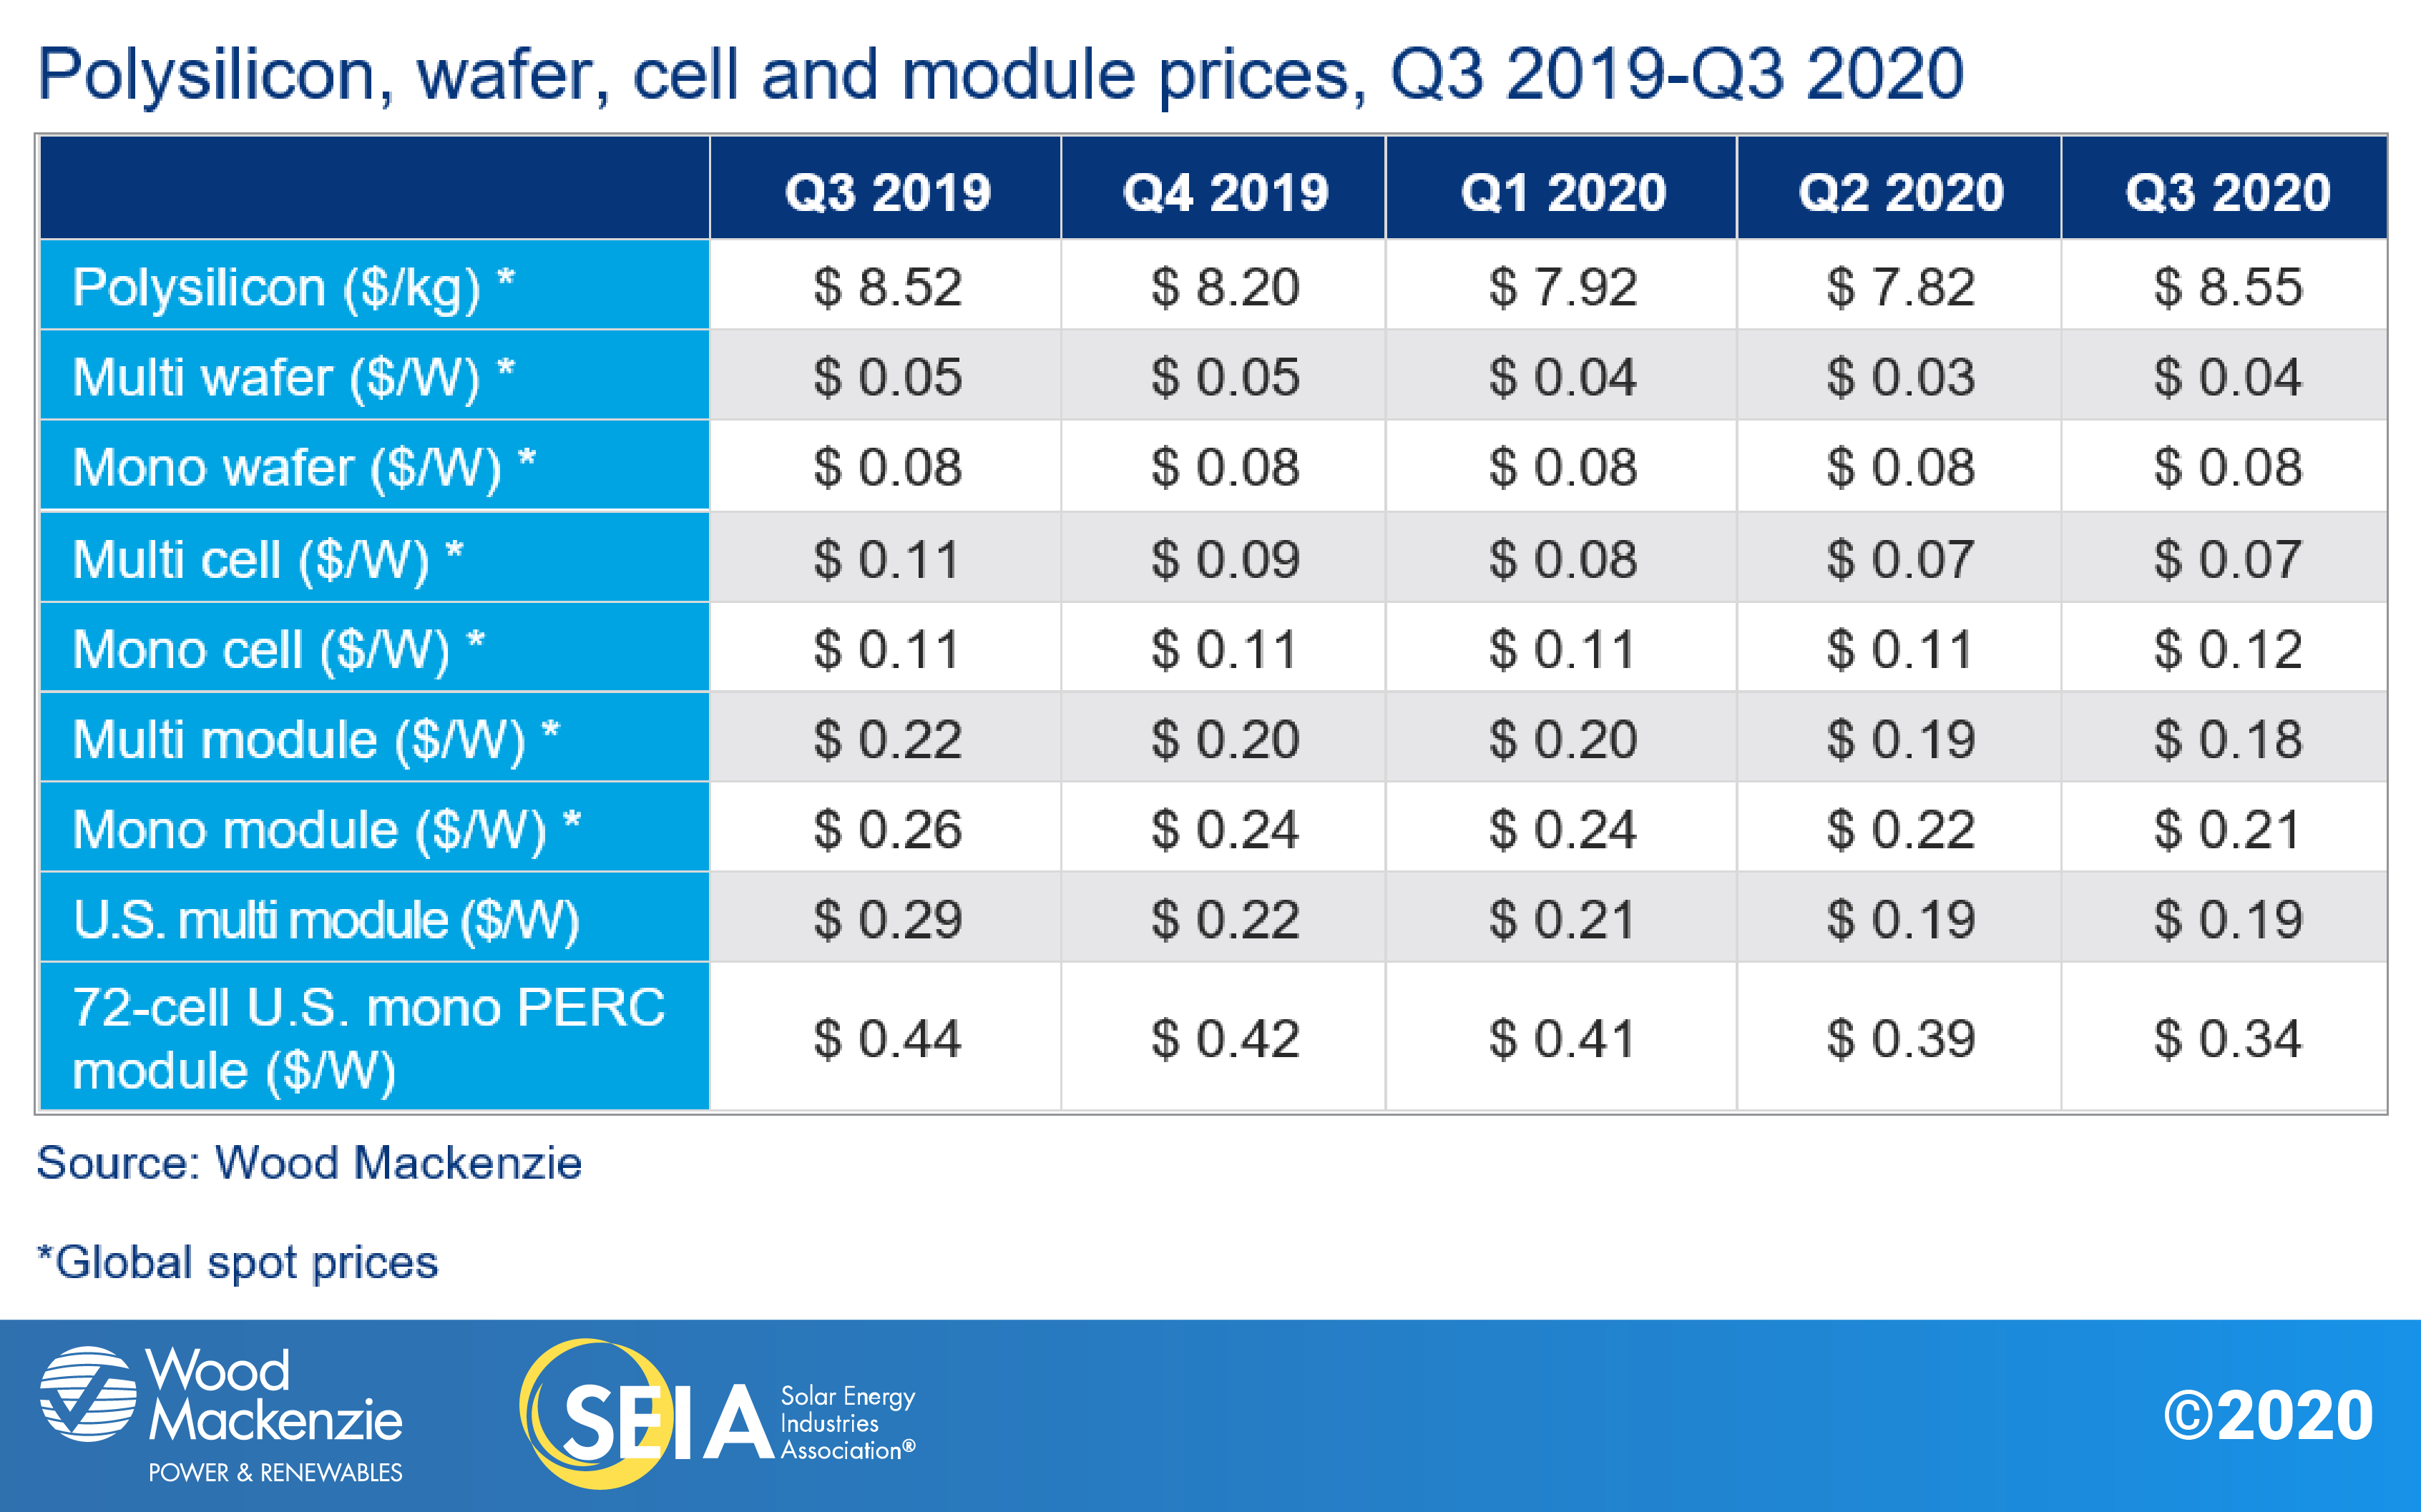
The coronavirus pandemic’s impact on the global PV supply chain decreased in Q3 2020. By July, the price declines caused by Covid-19 were less pronounced compared to the previous quarter. Nevertheless, the module supply chain was far from static. An explosion at GCL Poly’s facility in Xinjiang, China, and the flooding at Tongwei’s facility in Sichuan, China took 68,000 tons of polysilicon capacity offline. This is about 11% of the total global capacity, equivalent to 21 GW of wafers.
These major incidents triggered a domino effect on the supply chain, causing significant upstream price increases starting in August. Mono-grade polysilicon prices increased by 56% quarter-over-quarter. Mono wafer prices jumped by more than 20% during the same period while multi wafer prices increased for the first time in more than two years due to supply shortage. Mono PERC cell prices also went up by about one cent.
However, global average prices for multi and mono modules increased less rapidly relative to the upstream supply chain for two reasons: the declining share of silicon costs in total module production, and the lower sellers’ margin. As a result, global module prices still managed to decline compared to the previous quarter.
In the U.S., multi-silicon module prices were around $0.19/W in Q3 2020. Mono PERC module prices dropped meaningfully from $0.39/W in Q2 to $0.34/W in Q3 for utility-scale projects. Bifacial modules continued to enjoy the Section 201 tariff exemption in Q3. The office of the US Trade Representative announced its decision to reimpose the tariff in April. However, the US Court of International Trade sustained a preliminary injunction to block the tariff throughout Q3.
Without the tariff, the pricing of bifacial modules was, on average, competitive with mono-facial modules in the quarter. In October, President Trump issued a proclamation that revoked the bifacial exclusion and increased the year four tariffs from 15 to 18%. On 19 November 2020, the US Court of International Trade declined to apply the Preliminary Injunction to the October proclamation on procedural grounds. This paved the way for Customs to collect tariffs on bifacial modules barring a separate injunction.
About the Report
U.S. solar market insight® is a quarterly publication of Wood Mackenzie and the Solar Energy Industries Association (SEIA)®. Each quarter, we collect granular data on the U.S. solar market from nearly 200 utilities, state agencies, installers and manufacturers. This data provides the backbone of this U.S. solar market insight® report, in which we identify and analyze trends in U.S. solar demand, manufacturing and pricing by state and market segment. We also use this analysis to look forward and forecast demand over the next five years. All forecasts are from Wood Mackenzie, Limited; SEIA does not predict future pricing, bid terms, costs, deployment or supply.
-
References, data, charts and analysis from this executive summary should be attributed to “Wood Mackenzie/SEIA U.S. solar market insight®.”
-
Media inquiries should be directed to Wood Mackenzie’s PR team (WoodmacPR@woodmac.com) and Morgan Lyons (mlyons@seia.org) at SEIA.
-
All figures are sourced from Wood Mackenzie. For more detail on methodology and sources, click here.
-
Wood Mackenzie Power and Renewables partners with Clean Power Research to acquire project-level datasets from participating utilities that utilize the PowerClerk product platform. For more information on Clean Power Research’s product offerings, visit https://www.cleanpower.com/
Our coverage in the U.S. Solar Market Insight reports includes all 50 states and Washington, D.C. However, the national totals reported also include Puerto Rico and other U.S. territories. Detailed data and forecasts for 50 states and Washington, D.C. are contained within the full version of this report. To find out more, click here.

Note on U.S. solar market insight report title: WM P&R and SEIA have changed the naming convention for the U.S. solar market insight report series. Starting with the report released in June 2016 onward, the report title will reference the quarter in which the report is released, as opposed to the most recent quarter in which installation figures are tracked. The exception will be our year in review publication, which covers the preceding year’s installation volumes despite being released during the first quarter of the current year.
About the Authors
Wood Mackenzie Power & Renewables | U.S. Research Team
Michelle Davis, Senior Solar Analyst
Colin Smith, Senior Solar Analyst
Bryan White, Solar Analyst
Ravi Manghani, Global Head of Solar
Xiaojing Sun, Senior Solar Analyst
Molly Cox, Solar Analyst
Gregson Curtin, Research Associate
Solar Energy Industries Association | SEIA
Shawn Rumery, Director of Research
Rachel Goldstein, Solar and Storage Analyst
Colin Silver, Chief of Staff and Chief Content Officer
Justin Baca, Vice President of Markets & Research
License
Ownership rights
This report (“Report”) and all Solar Market Insight® (“SMI”)TM reports are jointly owned by Wood Mackenzie and the Solar Energy Industries Association (SEIA)®(jointly, “Owners”) and are protected by United States copyright and trademark laws and international copyright/intellectual property laws under applicable treaties and/or conventions. Purchaser of Report or other person obtaining a copy legally (“User”) agrees not to export Report into a country that does not have copyright/intellectual property laws that will protect rights of Owners therein.
Grant of license rights
Owners hereby grant user a non-exclusive, non-refundable, non-transferable Enterprise License, which allows you to (i) distribute the report within your organization across multiple locations to its representatives, employees or agents who are authorized by the organization to view the report in support of the organization’s internal business purposes, and (ii) display the report within your organization’s privately hosted internal intranet in support of your organization’s internal business purposes. Your right to distribute the report under an Enterprise License allows distribution among multiple locations or facilities to Authorized Users within your organization.
Owners retain exclusive and sole ownership of this report. User agrees not to permit any unauthorized use, reproduction, distribution, publication or electronic transmission of any report or the information/forecasts therein without the express written permission of Owners.
Disclaimer of warranty and liability
Owners have used their best efforts in collecting and preparing each report.
Owners, their employees, affiliates, agents, and licensors do not warrant the accuracy, completeness, correctness, non-infringement, merchantability, or fitness for a particular purpose of any reports covered by this agreement. Owners, their employees, affiliates, agents, or licensors shall not be liable to user or any third party for losses or injury caused in whole or part by our negligence or contingencies beyond Owners’ control in compiling, preparing or disseminating any report or for any decision made or action taken by user or any third party in reliance on such information or for any consequential, special, indirect or similar damages, even if Owners were advised of the possibility of the same. User agrees that the liability of Owners, their employees, affiliates, agents and licensors, if any, arising out of any kind of legal claim (whether in contract, tort or otherwise) in connection with its goods/services under this agreement shall not exceed the amount you paid to Owners for use of the report in question.

