Solar Market Insight Report 2020 Q3
The quarterly SEIA/Wood Mackenzie Power & Renewables U.S. Solar Market InsightTM report shows the major trends in the U.S. solar industry. Learn more about the U.S. Solar Market Insight Report. Released September 10, 2020.
1. Key Figures
- In Q2 2020, the U.S. solar market installed 3.5 GWdc of solar PV, down 6% from Q1
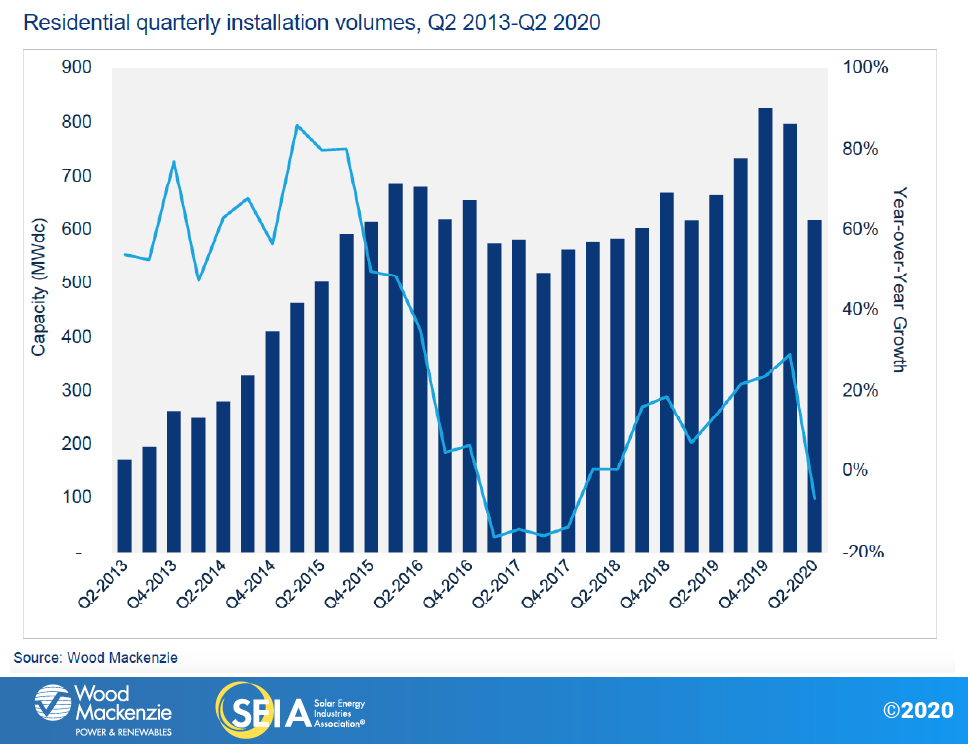
- Residential installations were down 23% from Q1 to Q2 2020, due largely to shelter-in-place orders during the initial stages of the Covid-19 pandemic that imposed restrictions on selling and installing residential solar.
- Non-residential installations were down 12% from last quarter and 19% from the same quarter last year as Covid-19 restrictions complicated project installation and zoning challenges delayed development timelines.
- Nearly 2.5 GWdc of utility-scale projects were installed in Q2 2020, representing 71% of all solar capacity brought online this quarter. This segment has seen minimal Covid-19 related construction impacts.
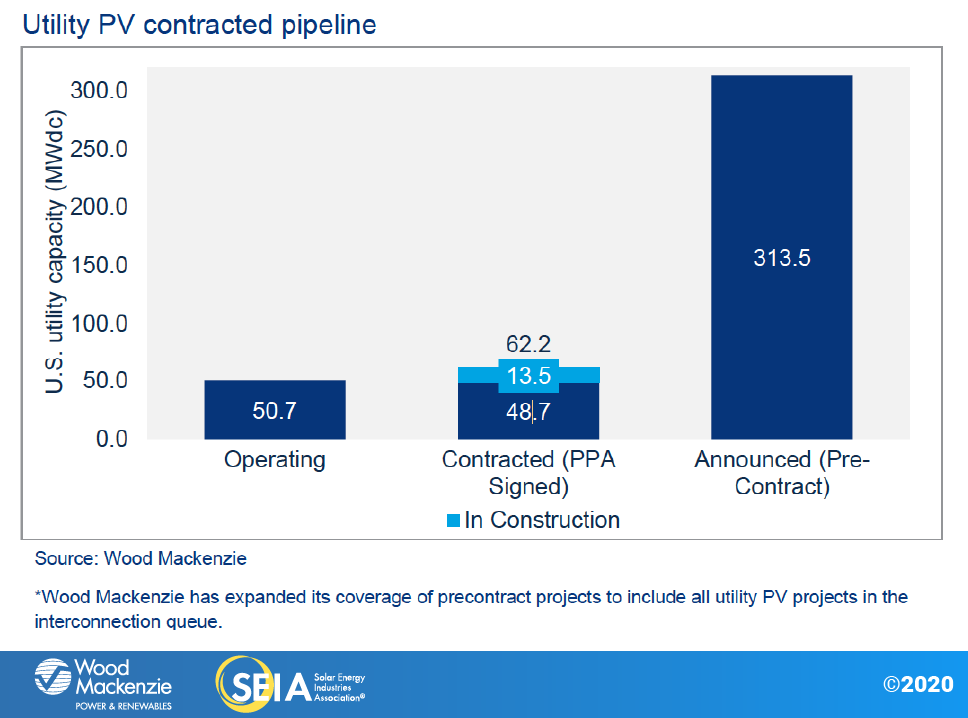
- A total of 8.7 GWdc of new utility PV power-purchase agreements were announced in Q2 2020, bringing the contracted pipeline to a record total of 62 GWdc.
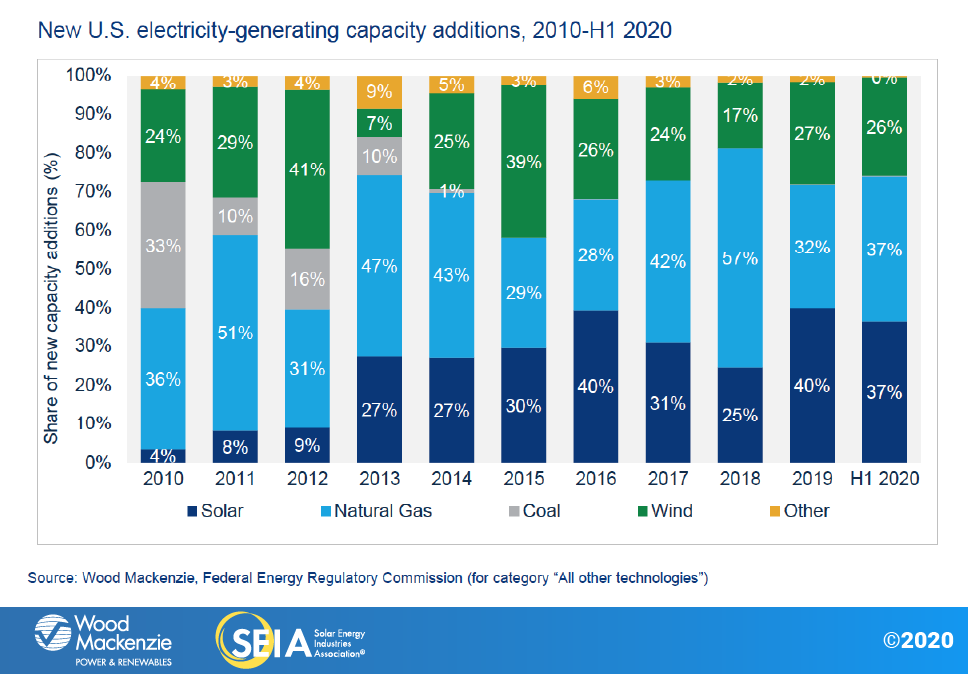
- Solar accounted for 37% of all new electricity generating capacity added in the U.S. in H1 2020, similar to the share of new capacity added in 2019.
- Wood Mackenzie forecasts 37% annual growth in 2020, with over 18 GWdc of installations expected. Forecasts have increased considerably since last quarter as impacts from Covid-19 have been less severe than anticipated, but they are still down 6% relative to pre-pandemic forecasts.
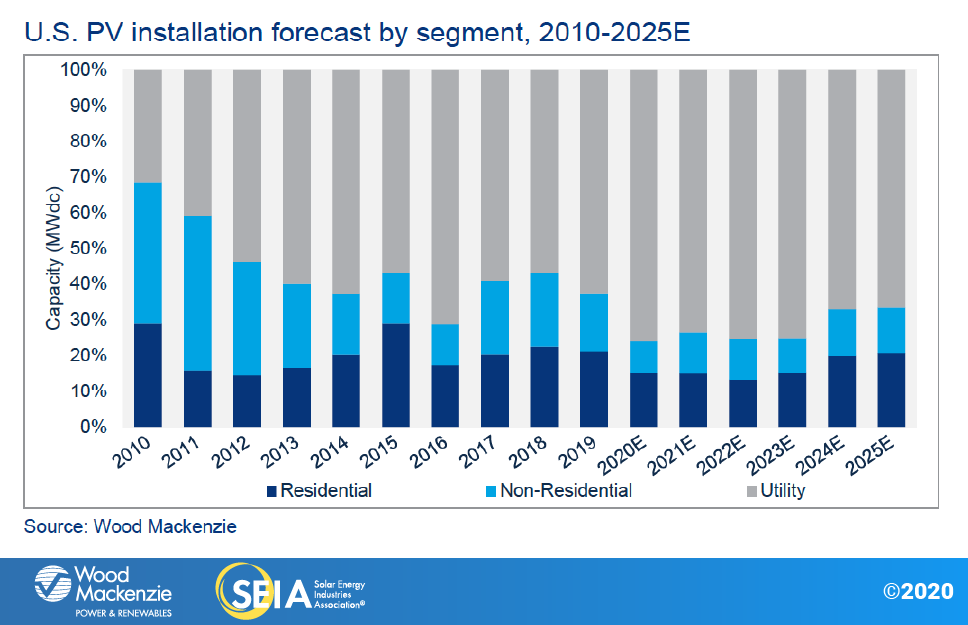
- In total, the U.S. solar market will install nearly 100 GWdc of solar from 2021-2025, 42% more than was installed over the last five years. By 2025, one-fifth of new utility PV systems, one-third of new residential solar systems and one-quarter of new non-residential solar systems will be paired with energy storage.
2. Introduction
While the first quarter of 2020 was relatively insulated from the impacts of the novel coronavirus, Q2 was the first full quarter in which the U.S. solar industry was exposed to the risks associated with the pandemic.
In Q2 2020, the U.S. solar market installed 3.5 gigawatts-direct current (GWdc) of solar photovoltaic (PV) capacity, a 7% decline quarter-over-quarter but a 52% increase year-over-year and the largest Q2 ever. More than 70% of quarterly capacity installed came from the utility segment, which broke a Q2 record with 2.5 GW installed. Utility PV has seen less severe construction impacts from Covid-19 than other parts of the industry, given its limited consumer interaction and lengthier development timelines.
Meanwhile, both distributed segments experienced more significant challenges due to the pandemic, as state-mandated work stoppages impacted sales, permitting, installation and interconnection.
Residential installations in Q2 dropped 23% from the previous quarter, with the 617 MW installed representing the lowest quarterly total in more than a year. The non-residential PV segment (which includes commercial, government, nonprofit and community solar) saw a 12% quarterly decline and its lowest quarterly total in four years. Despite this, across all market segments, solar PV accounted for 37% of all new electricity-generating capacity additions through H1 2020, second only to natural gas.
The coronavirus pandemic hit the residential solar sector the hardest in Q2
With the first shelter-in-place orders issued in mid-March in response to the growing Covid-19 threat, Q2 2020 was expected to bear the brunt of the impact of the pandemic. And indeed, it did. Quarterly capacity additions fell from a Q1 record of nearly 800 MW installed to 617 MW installed in Q2 2020 – a 23% quarter-over-quarter decline. By historical standards, the decline was slightly less dramatic; annual capacity additions fell 7% relative to Q2 2019. Still, the Q2 slide broke a streak of four consecutive quarters of quarterly growth and represented the smallest installation total since Q1 2019.
On a state-by-state basis, markets that imposed stricter shelter-in-place guidelines saw the most pronounced installation decline quarter-over-quarter. By and large, this affected most – though not all – established state markets.
While the Northeast and California were particularly hard-hit by the virus – leading to quarterly solar installation declines ranging from 25% to 75% — some states experienced much lower caseloads in early Q2 and subsequently imposed fewer restrictions on businesses and consumers during that time. Though these states eventually began to see an uptick in reported cases as we entered the summer months, Arizona, Texas and Florida ultimately imposed less-restrictive (if any) shelter-in-place orders, and subsequently saw less of an impact on residential solar installations, which helped support the market.
Beginning in Q2, shelter-in-place orders initially restricted many solar businesses from engaging in the face-to-face interaction that is a cornerstone of the residential lead-generation process, such as door-to-door sales, community events and in-store sales.
Moreover, shelter-in-place orders also inhibited in-person consultations, which are integral to any residential solar sales process regardless of customer-acquisition channel. However, many of the more restrictive orders were ultimately lifted in major state markets in the Northeast and California as caseloads began to decrease in the latter half of Q2.
In total, the duration of the stay-at-home orders, the number of states that ultimately adopted such orders and the severity of the individual impact on the residential solar market had less of an impact than initially forecast.
More importantly, the residential solar industry underwent significant business model innovation during the pandemic. While we initially expected in-person permitting processes to present a substantial barrier, many jurisdictions transitioned to online permitting, which saw dramatic improvements as Q2 progressed. Meanwhile, many residential installers also transitioned their entire sales organizations to online sales, which, though a difficult process, began to reap benefits as sales staff acclimated to the new environment.
This combination of business-model innovations and rollbacks of restrictive shelter-in-place orders supported a gradual uptick in sales volumes as Q2 progressed. As a result, the residential solar market was less severely impacted by the pandemic than we initially forecasted.
Non-residential solar beset by permitting and project delays, but new commercial solar origination appears healthy despite broader economic concerns
At 372 MW installed, Q2 2020 saw the lowest quarterly installed capacity of non-residential solar since Q2 2016, with a quarter-over-quarter decline of 15% and year-over-year decline of 21%. Shelter-in-place orders initially halted construction in key markets; although most jurisdictions eventually designated commercial project construction as an essential activity, the delay nonetheless pushed back construction timelines. Meanwhile, utility interconnection timelines were also delayed significantly as utilities prioritized essential functions.
While a handful of issues slowed non-residential solar development in the early months of the pandemic – expected delays in origination, permitting, siting, construction and interconnection – most of these bottlenecks have since been addressed. Initial permitting concerns have eased as local authorities have moved town planning meetings to online venues.
Most construction and interconnection processes have proceeded as the market adapts to current conditions, with the primary effect of pushing back interconnection timelines. And despite lingering concerns about the state of the economy, project origination appears to have largely recovered after the initial wave of Covid-19.
Though quieter on the policy front, the results of National Grid’s cluster study in Massachusetts, along with revisions to the state’s SMART incentive program, provide some limited upside to the non-residential outlook, while 100% renewable portfolio standard laws recently passed in Virginia and Maine provide increased support to the non-residential forecast.
Utility PV continues to see strong growth but risks loom on the horizon
Utility PV has reached a new milestone with more than 50 GWdc now in operation. In 2011, the U.S. completed its first gigawatt of utility-scale capacity. At a 46% compound annual growth rate, it has taken less than a decade to reach 50 GWdc. At the current growth rate, it is likely to reach 100 GWdc by 2023 and exceed 250 GWdc by 2030. Despite the turbulent times caused by the coronavirus pandemic, utility solar is racing forward. Power-purchase agreements totaling a remarkable 8.7 GWdc were announced this past quarter, driving the contracted pipeline to a record high of 62.2 GWdc. The pandemic has caused very few procurement delays beyond what developers and engineering, procurement and construction (EPC) providers see under normal conditions. Across the U.S., electricity demand remains strong, and utility PV is cost-competitive with natural gas and other forms of power generation in the majority of state markets.
However, we are beginning to see signs of potential headwinds. With increasing frequency, banks and investors are showing signs of insufficient tax equity investment for all projects in development. Additionally, some developers have expressed concern that there will not be enough EPC bandwidth to complete their development pipeline. This is all combined with broader financial market instability caused by the coronavirus pandemic.
Financiers have reported that they are having some of their most active years ever but that some projects are simply not finding the funding they need, which could result in delays to commercial operation dates. This has created a unique situation where the U.S. has the largest development pipeline in its history but with some projects facing a higher-than-normal risk of attrition or cancellation.
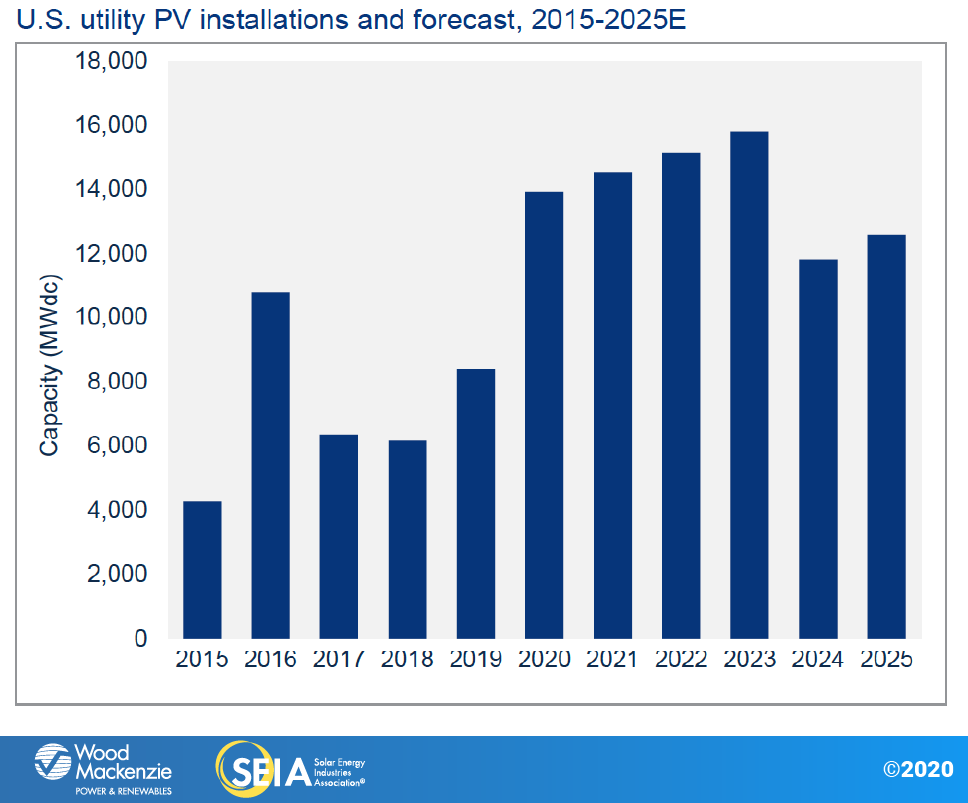
Overall, we have increased the 2020-2025 forecast by 1.1 GWdc due to subsiding concerns about coronavirus impacts, renewed confidence in the long-term outlook and the growth of the development pipeline. Over the next five years, 83 GWdc of utility PV capacity will come online. Wood Mackenzie’s 2020 to 2021 forecasts have decreased as projects get pushed out to 2022 and 2023 as we begin to see the first signs of project spillover to the last years of federal Investment Tax Credit eligibility. While 2024 will remain strong, we are seeing the first wave of projects begin to be pulled into 2023 delivery to capitalize on the greater ITC benefits.
Overall demand continues to grow as utilities announce more solar procurement targets in their integrated resource plans, backing aggressive state renewable targets. However, with financial markets still at risk of a downturn or recession due to the pandemic, the possible inability to fund projects is the largest downside risk to our forecast.
Smaller projects face a higher likelihood of being passed over, and tax equity investors are likely to be more hesitant to work with new or less-established developers. In addition to the tightness of tax equity markets, the cost of debt has also crept up a few basis points as debt providers have become wary of nontraditional investments.

3. Market Segment Outlooks
3.1. Residential PV
Key Figures
- 617 MWdc installed in Q2 2020
- Down 23% from Q1 2020
- Down 7% from Q2 2019
Despite the 23% quarterly decline from Q1 in response to the Covid-19 crisis, residential solar installation volumes in Q2 2020 were more resilient than initially forecasted. This is due to several factors.
First, we initially expected additional states outside of the Northeast and California to implement strict shelter-in-place orders once they reached comparable confirmed levels of Covid-19 cases. This would have similarly constrained sales and installations in all key state markets as it did in the Northeast and California. However, this never came to fruition. Florida, Arizona and Texas – the second, third and fourth largest state markets respectively in Q1 2020 – did not ultimately impose restrictive shelter-in-place orders despite increases in confirmed cases. Accordingly, they did not see the significant installation declines that other major state markets experienced as a byproduct of restrictive shelter-in-place orders.

Second, Wood Mackenzie forecasted – and still forecasts – a 5% contraction in annual gross domestic product. Accordingly, our forecasts not only considered the projected impact on sales due to social distancing measures, but also the impacts of a near-term economic shock that was expected to dramatically increase unemployment, reducing consumer spending on large home improvement projects. But the nature of the Covid-19 recession is peculiar. While consumer spending initially decreased considerably in March and April, it began to rebound in the summer months, helped by the additional $600/week in unemployment benefits provided by the federal CARES Act that has since expired. More importantly, total unemployment peaked at 15% in the initial months of the pandemic before declining to 10.2% in July. However, this recession has disproportionately displaced service and hospitality workers, whose unemployment rates reached 25% in July. Because a larger share of these workers either don’t own their home, are young (Covid-19-driven unemployment is more than double for those under 25) or are below the typical income and credit thresholds that major installers require to qualify for consumer financing, the expected recessionary effects on typical residential solar customer demographics (that skew more toward professional occupations) have been less acute than expected.
Though the transition from largely in-person sales processes to a full-cycle virtual sales approach had its fair share of issues in April and May, the solar industry – and particularly large and midsized regional installers – have seen lead volumes and closed sales return to pre-Covid-19 levels.
On the other hand, smaller companies that rely heavily on word-of-mouth sales have had a harder time transitioning. For 2020, the near-term impacts from shelter-in-place orders will be felt most intensely in Q2, as many large installers report healthy sales pipelines that they expect to fulfill throughout H2 2020. But despite sales rebounding in H2 2020, most installers report installation crew capacity has decreased since the pandemic began, as the process of ramping back up after having furloughed crews comes with administrative and logistical hurdles. Installers remain cautious about over-hiring given considerable near-term economic uncertainty. Accordingly, we do not expect remaining quarterly volumes in 2020 to exceed record-breaking Q1 installation volumes.
Though Wood Mackenzie forecasts a 5% contraction to U.S. GDP in 2020, economic uncertainty has, to date, had limited impact on sales pipelines, as many installers have indicated that the summer has seen record-breaking months for sales. While strict shelter-in-place orders did have some impact on installation totals in certain state markets, the adaptations that companies have instituted since the early days of the pandemic leave them better positioned to adjust to future shutdowns, should states find them to be necessary.
Furthermore, Q2 installations and sales pipelines that are largely sold out for 2020 suggest that the impact for residential solar will be limited in the near term. Accordingly, we have increased our 2020 residential forecast since last quarter and are now expecting flat growth compared to 2019 before a 7% annual increase in 2021 as the market continues a tepid recovery.

Beyond the impact of the coronavirus pandemic in 2020-2021, the ITC stepdown in 2022 will further complicate recovery efforts, though modest growth will resume in 2023 and continue into 2025, based on economic fundamentals as the market adjusts to post-ITC market conditions. Absent broader federal climate policy, long-term growth in a post-ITC world will be contingent on continued geographic diversification outside of established state markets as well as regulatory, technological and business-model innovation to improve product offerings in the solar-plus-storage space. Assuming modest growth on these fronts, annual residential solar growth is expected to reach low-teen percentages by the mid-2020s.
3.2. Non-residential PV
Key Figures
- 384 MWdc installed in Q2 2020
- Down 12% from Q1 2020
- Up 19% over Q2 2019
The second quarter of 2020 was the lowest quarter for non-residential solar PV since Q2 2016. This is in large part due to delayed construction and interconnection in primary markets in response to shelter-in-place orders. Shovel-ready, permitted projects with signed contracts could continue construction into Q2 unless local authorities restricted developers from doing so, such as in the case of California and New York for limited periods of time during the initial stages of the lockdown.
For much of Q2, difficulty in obtaining permits from local zoning authorities created interconnection delays of three to six months, as most large ground-mount PV projects require public meetings to obtain approval to construct. While some locales have transitioned to online zoning meetings, there is no uniformity to the process across jurisdictions. Though developers’ ability to obtain permits has improved moving into Q3, the delays that accrued through Q2 will still have the effect of pushing many projects into 2021. Accordingly, the near-term impact of the coronavirus pandemic on non-residential solar will result in significant project delays – though not necessarily cancellations – in 2020, resulting in a 23% decline from 2019 volumes. Delayed projects will spill into 2021, leading to a 35% increase over 2020.
While the near-term impact of the coronavirus outbreak on the non-residential space will result in project delays, the long-term impact of GDP contraction and a decline in business expenditures for capital investments will have some lingering effects on new origination opportunities as well. Though companies transitioning to the “new normal” were focused on prioritizing core operations during the initial stages of the pandemic, commercial origination seems to have rebooted going into H2 2020 as businesses adapt to the circumstances.
Accordingly, 2022 will grow only slightly over 2021 before the market experiences another contraction in response to the ITC expiration in 2023. Meanwhile, recently passed clean energy legislation in Virginia and Maine will begin to take effect over the next few years. Non-residential projects stemming from Maine’s uncapped Net Energy Billing program have already flooded queues and will come online from 2020-2022, while Virginia’s 100% renewable portfolio standard and expansion of the commercial pilot power-purchase agreement program are expected to bolster installations in our outlook.

3.3. Utility PV
Key Figures
- 2.5 GWdc installed in Q2 2020, the largest Q2 for utility PV in history
- Utility PV pipeline currently totals 62.2 GWdc
U.S. utility solar PV saw its strongest Q2 in history, with 2.5 GWdc coming online, while the pipeline of new projects has hit a new high of 62 GWdc. For several weeks through April and May, force majeure was the hot topic of the utility solar sector, with developers, offtakers and financiers wondering if projects were going to be indefinitely delayed due to the coronavirus outbreak. Since that time, force majeure has been seldom mentioned and project delays have been minimal.
A total of 13.6 GWdc of utility PV projects are currently under construction, 8.2 GWdc of which are on track to be completed in 2020. Despite the turbulence in Q2, construction of utility PV projects has remained largely on track, resulting in only a minor decrease to our 2020 forecast. Additional minor reductions have been made to our 2021 forecast, due in large part to greater uncertainty in the ability of individual projects to obtain tax equity funding, generate adequate revenue with the rising cost of capital, or simply get built in time. It is likely that established, larger developers and large projects will have the easiest time finding tax equity financing, while smaller projects and less-established developers will have a harder time.
Wood Mackenzie has increased its 2022 and 2023 forecast by 1.8 and 2.4 GWdc, respectively, due to spillover from delayed 2020 and 2021 projects, new project announcements, utilities’ resource plan targets, and demand pull-in from the stepdown of the ITC from 22% to 10%. Of the projects announced in Q2, 88% are targeting a 2022 or 2023 completion date. This has significantly strengthened our midterm forecast.
Although individual projects face the risk of delay or not finding adequate financing, many developers that have built out their development pipelines and safe-harbored projects for the 30% or 26% ITC are well positioned to complete projects before the end of 2023. Therefore, projects with original target commercial operation dates (CODs) in 2021 are being pushed out into the 2022-2023 timeframe. A select few projects have already pushed out target COD dates in their interconnection queue filings or Securities and Exchange Commission filings, and we expect to see more follow suit in the coming months.
Wood Mackenzie forecasts slight declines in 2024 and 2025 to 11.8 and 12.6 GWdc, respectively. Overall, the long-term demand for utility PV will remain high after the ITC stepdown. Across more than 100 utility integrated resource plans, there is more than 19 GW of demand for utility solar in 2024 and 2025, with more expected to be announced in subsequent IRPs scheduled for release in the coming months. However, developers have virtually no incentive to bring projects online in 2024 that could be brought online in 2023 with a higher federal Investment Tax Credit.
This will inevitably cause projects to get pulled into 2023 when possible, which could leave 2024 with projects that were either delayed from 2023 or simply developed too late to qualify for a 22% or higher ITC. 2025 will see additional growth over 2024 as demand picks back up for more solar resources, especially systems paired with energy storage.
The economic competitiveness of utility PV ultimately underpins our confidence in the long-term forecast. After the stepdown of the federal ITC, utility solar will remain cost-competitive with other renewables and with baseload power such as combined-cycle natural gas. As a result, utilities will continue turning to utility solar for additional capacity additions and to replace aging coal plants.
Along with declines in solar system costs, similar declines in the cost of large-scale energy storage are taking place, enabling solar-plus-storage deployments to ramp up even further. At the end of 2019, only 2% of utility PV megawatts operating on the grid were paired with energy storage. By 2023, that number will rise to 13%. While standalone energy storage will also be deployed to the grid, the additions of solar paired with storage will enable even greater levels of utility PV, especially in markets like Hawaii and California looking to achieve 100% zero carbon or 100% renewable energy targets.

4. National Solar PV System Pricing
We employ a bottom-up modeling methodology to capture, track and report national average PV system pricing for the major market segments. Our bottom-up methodology is based on tracked wholesale pricing of major solar components and data collected from multiple interviews with industry stakeholders. Due to increased demand for mono PERC solar modules, beginning with the 2019 year in review report, we began to report blended module prices for the non-residential and utility market segments in addition to residential. This represents a weighted average of multi-silicon and mono PERC solar modules as opposed to pricing for multi-silicon modules only. Q4 2019 is the first quarter in which these new blended system prices were applied, so previous quarters for the non-residential and utility sectors will not be commensurable with Q4 2019 and onward. Mono PERC solar modules are more expensive than multi-silicon modules, so the new blended module price methodology will yield higher system prices.

In Q2 2020, system pricing fell across all market segments. System pricing fell quarter-over-quarter by 0.2%, 0.7%, 3.5% and 3.1% in the residential, non-residential, utility fixed-tilt and utility single-axis tracking markets, respectively. Prices across all market segments are now at $2.84/Wdc, $1.39/Wdc, $0.81/Wdc and $0.95/Wdc for residential, non-residential, utility fixed-tilt and utility single-axis tracking systems, respectively. Utility fixed-tilt pricing showed the steepest decline in quarter-over-quarter prices, compared to all other market segments. Residential system prices will be impacted by the Covid-19 pandemic more than all other market segments; this is due to its shorter project cycles and more stages of project development being exposed to the pandemic.
5. Component Pricing
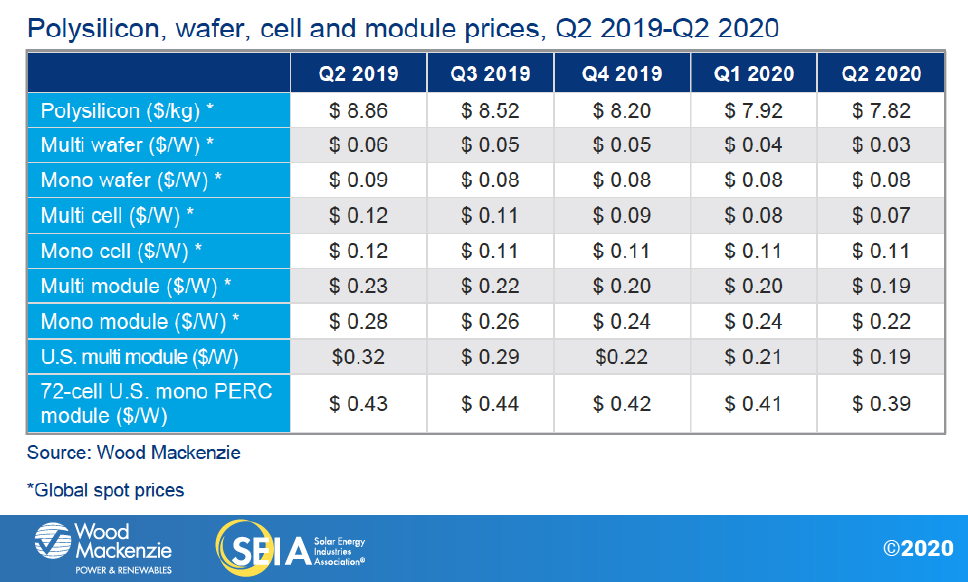
The coronavirus pandemic continued to affect the global PV supply chain in Q2 2020. Although module production in China had returned to pre-pandemic levels by April, production in Southeast Asia, India, Europe and the U.S. were scaled down due to local public health measures. However, the bigger impact to the supply chain is the destruction of global demand due to shelter-in-place measures. Lower-than-expected global solar demand in the rest of 2020 put significant downward pressure on solar component prices. Multi wafer, cell and module prices continued to trend lower, reflecting the changing market preference away from multi-silicon products to mono-silicon products. Prices of mono wafer and cells declined slightly. Mono PERC module prices dropped significantly across the globe, led initially by European markets, followed by the U.S. On a quarter-over-quarter basis, mono PERC module prices are 9% lower. As of the end of Q2 2020, prices along the entire supply chain continued to decline week over week.
In the U.S., multi-silicon module prices were around $0.19/W in Q2 2020. The continued low price reflects the market’s preference for mono modules over multi modules. Mono PERC module prices dropped meaningfully from $0.41/W in Q1 to $0.39/W in Q2 for utility-scale projects.
Bifacial modules continued to benefit from the Section 201 tariff exemption in Q2. In April, the Office of the U.S. Trade Representative announced its decision to reimpose the tariff. This decision was challenged at the U.S. Court of International Trade and the exclusion remains in place pending a decision by the CIT. Without the tariff, the pricing of bifacial modules was, on average, competitive with mono-facial modules in Q2 2020.
About the Report
U.S. solar market insight® is a quarterly publication of Wood Mackenzie and the Solar Energy Industries Association (SEIA)®. Each quarter, we collect granular data on the U.S. solar market from nearly 200 utilities, state agencies, installers and manufacturers. This data provides the backbone of this U.S. solar market insight® report, in which we identify and analyze trends in U.S. solar demand, manufacturing and pricing by state and market segment. We also use this analysis to look forward and forecast demand over the next five years. All forecasts are from Wood Mackenzie, Limited; SEIA does not predict future pricing, bid terms, costs, deployment or supply.
-
References, data, charts and analysis from this executive summary should be attributed to “Wood Mackenzie/SEIA U.S. solar market insight®.”
-
Media inquiries should be directed to Wood Mackenzie’s PR team (WoodmacPR@woodmac.com) and Morgan Lyons (mlyons@seia.org) at SEIA.
-
All figures are sourced from Wood Mackenzie. For more detail on methodology and sources, click here.
-
Wood Mackenzie Power and Renewables partners with Clean Power Research to acquire project-level datasets from participating utilities that utilize the PowerClerk product platform. For more information on Clean Power Research’s product offerings, visit https://www.cleanpower.com/
Our coverage in the U.S. Solar Market Insight reports includes all 50 states and Washington, D.C. However, the national totals reported also include Puerto Rico and other U.S. territories. Detailed data and forecasts for 50 states and Washington, D.C. are contained within the full version of this report. To find out more, click here.
Note on U.S. solar market insight report title: WM P&R and SEIA have changed the naming convention for the U.S. solar market insight report series. Starting with the report released in June 2016 onward, the report title will reference the quarter in which the report is released, as opposed to the most recent quarter in which installation figures are tracked. The exception will be our year in review publication, which covers the preceding year’s installation volumes despite being released during the first quarter of the current year.
About the Authors
Wood Mackenzie Power & Renewables | U.S. Research Team
Austin Perea, Senior Solar Analyst (lead author)
Colin Smith, Senior Solar Analyst
Michelle Davis, Senior Solar Analyst
Xiaojing Sun, Senior Solar Analyst
Bryan White, Solar Analyst
Molly Cox, Solar Analyst
Gregson Curtin, Research Asssociate
Solar Energy Industries Association | SEIA
Shawn Rumery, Director of Research
Rachel Goldstein, Solar and Storage Analyst
Colin Silver, Chief of Staff and Chief Content Officer
Justin Baca, Vice President of Markets & Research
License
Ownership rights
This report (“Report”) and all Solar Market Insight® (“SMI”)TM reports are jointly owned by Wood Mackenzie and the Solar Energy Industries Association (SEIA)® (jointly, “Owners”) and are protected by United States copyright and trademark laws and international copyright/intellectual property laws under applicable treaties and/or conventions. Purchaser of Report or other person obtaining a copy legally (“User”) agrees not to export Report into a country that does not have copyright/intellectual property laws that will protect rights of Owners therein.
Grant of license rights
Owners hereby grant user a non-exclusive, non-refundable, non-transferable Enterprise License, which allows you to (i) distribute the report within your organization across multiple locations to its representatives, employees or agents who are authorized by the organization to view the report in support of the organization’s internal business purposes, and (ii) display the report within your organization’s privately hosted internal intranet in support of your organization’s internal business purposes. Your right to distribute the report under an Enterprise License allows distribution among multiple locations or facilities to Authorized Users within your organization.
Owners retain exclusive and sole ownership of this report. User agrees not to permit any unauthorized use, reproduction, distribution, publication or electronic transmission of any report or the information/forecasts therein without the express written permission of Owners.
Disclaimer of warranty and liability
Owners have used their best efforts in collecting and preparing each report.
Owners, their employees, affiliates, agents, and licensors do not warrant the accuracy, completeness, correctness, non-infringement, merchantability, or fitness for a particular purpose of any reports covered by this agreement. Owners, their employees, affiliates, agents, or licensors shall not be liable to user or any third party for losses or injury caused in whole or part by our negligence or contingencies beyond Owners’ control in compiling, preparing or disseminating any report or for any decision made or action taken by user or any third party in reliance on such information or for any consequential, special, indirect or similar damages, even if Owners were advised of the possibility of the same. User agrees that the liability of Owners, their employees, affiliates, agents and licensors, if any, arising out of any kind of legal claim (whether in contract, tort or otherwise) in connection with its goods/services under this agreement shall not exceed the amount you paid to Owners for use of the report in question.
