Solar Market Insight Report 2016 Q4
Purchase the Full Report | Press Release
The quarterly SEIA/GTM Research U.S. Solar Market Insight™ report shows the major trends in the U.S. solar industry. Learn more about the U.S. Solar Market Insight Report.
Key Figures
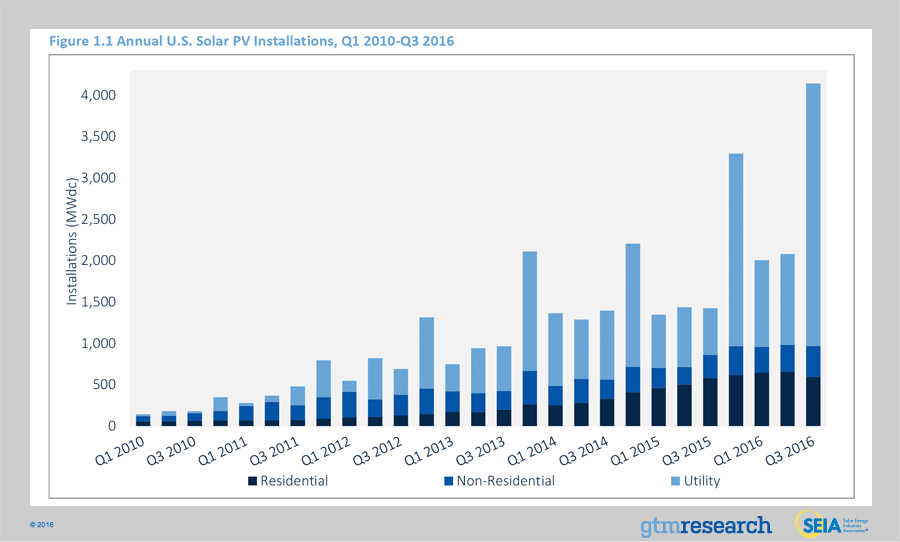
- Primarily driven by utility PV, the U.S. installed 4,143 MWdc of solar PV in Q3 2016, increasing 99% over Q2 2016 and 191% over Q3 2015. This marks the largest quarter ever for the U.S. solar industry.
- On average, a new megawatt of solar PV capacity came on-line every 32 minutes in Q3 2016.
- Between Q1 and Q3 2016, solar accounted for 39% of all new electric generating capacity brought on-line in the U.S, ranking second only to natural gas as the largest source of new capacity additions.
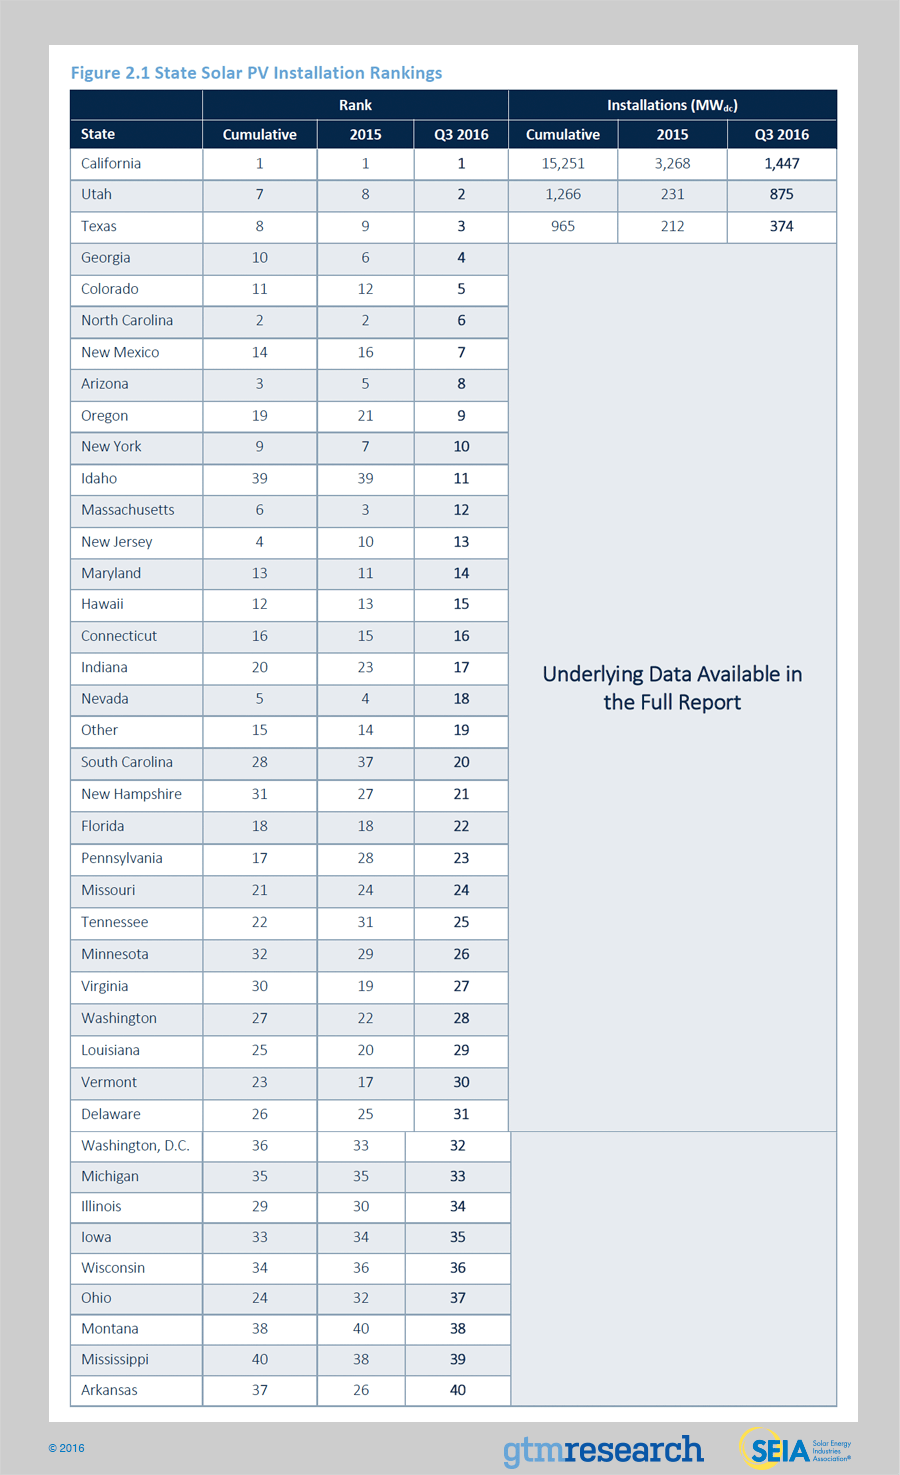
- Through Q3 2016, the U.S. solar PV market has already surpassed its record total from 2015, driven by 14 states that installed more than 100 MWdc between Q1 and Q3 2016.
- In Q3 2016, California became the first state ever to add more than 1 GWdc of utility PV in a single quarter.
- For only the second time in five years, the residential PV market fell quarter-over-quarter, primarily due to a slowdown in major state markets, especially California.
- In Q3 2016, community solar added more capacity than the segment installed in all of 2015, playing a key role in supporting the second-largest quarter ever for the non-residential PV market.
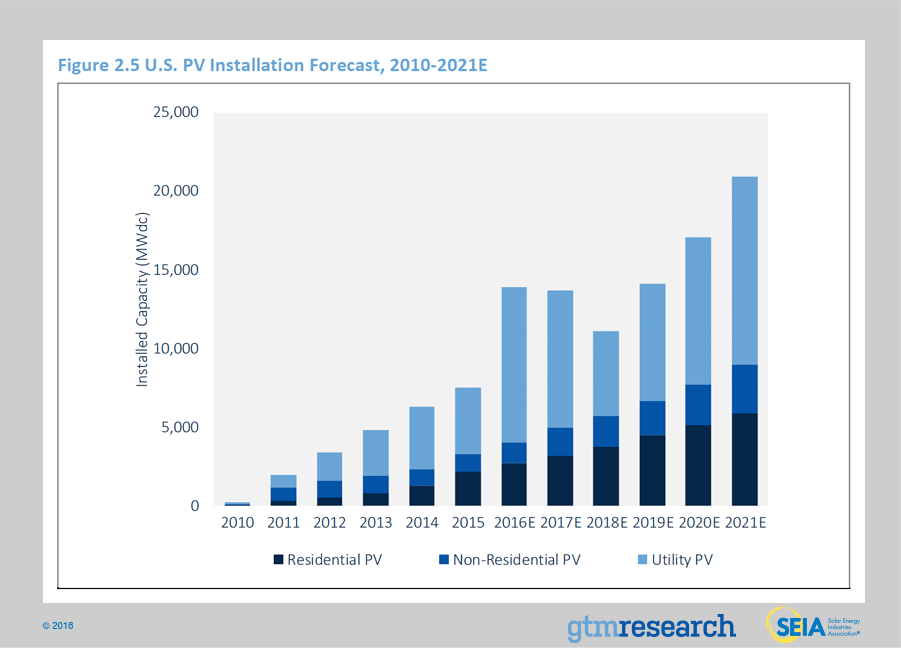
- GTM Research forecasts that 14.1 GWdc of new PV installations will come on-line in 2016, up 88% over 2015. Utility PV is expected to account for over 70% of that new capacity.
1. Introduction
In Q3 2016, the U.S. solar market installed 4,143 megawatts direct current (MWdc), up 191% over Q3 2015. Most notably, more than 75% of the Q3 2016 installation total came from the utility PV segment, which posted its largest quarterly total of more than 3 GWdc and made Q3 the largest quarter ever for the U.S. solar market. Altogether, U.S. solar installations drove 60% of new electric generating capacity additions in Q3 2016, a record quarterly market share.
Over the remainder of this year, Q4 2016 remains on track to break Q3’s installation record, due to more than 4.8 GWdc of utility PV expected to come on-line. However, more than 50% of the original utility PV pipeline intended for 2016 has successfully pushed out interconnection into 2017 or later. This multi-gigawatt spillover of utility PV installations was enabled by the extension of the federal Investment Tax Credit, which Congress approved last December.
While 2016 is expected to eclipse the 10 GWdc annual mark for the first time ever, and by a wide margin, three trends are expected to shape the near-term U.S. solar market outlook. Looking ahead to 2017, each of these trends raise challenging questions that will shape to what extent utility, non-residential, and residential solar will grow (or fall) over the next few years.
Trend #1: Despite dirt-cheap PPA pricing, the utility PV segment is struggling to reboot procurement given the degree of demand pull-in in 2016.
Despite PPA pricing consistently ranging between $35/MWh and $60/MWh, the uptick in new utility offtakers has only partly countered the demand rollback from utilities that over-procured in the past couple of years. Most notably, California’s investor-owned utilities have already procured enough renewables to meet their RPS obligations through the end of this decade.
In turn, new development has increasingly focused on distinct sub-segments, for example, utilities with viable contracts offered via the Public Utility Regulatory Policies Act (PURPA). Another segment to watch is retail customers seeking offsite wholesale PPAs. Corporate customers have already procured more than 1.5 GWdc of offsite wholesale solar for post-2016 installation dates. And in California, community choice aggregation is gaining momentum, with an addressable market of more than 3 GWdc through 2020 based on current and announced CCA programs.
Commercial solar demand is tapping into offsite project solutions, specifically community solar and offsite wholesale PPAs.
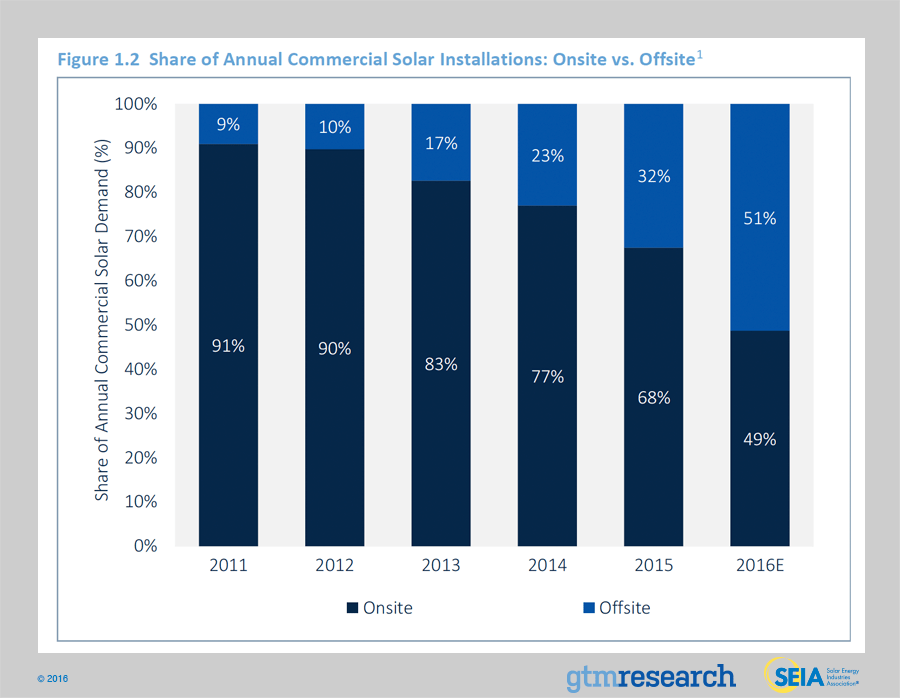
As mentioned, large corporate customers have ramped up procurement of offsite wholesale solar projects, which are currently accounted for in the utility PV segment. This demand has largely come from Fortune 500 customers with large industrial loads or aggressive, near-term renewable energy procurement targets. By year’s end, GTM Research expects more than 800 MWdc of offsite wholesale solar to come on-line, growing fourfold over 2015.
On top of that, investment-grade commercial and municipal customers continue to serve as anchor subscribers to most community solar installations. Altogether, community solar is expected to add more than 200 MWdc on an annual basis in 2016, growing fourfold over last year. In turn, for the first time ever, more than half of annual solar PV capacity involving non-residential customers will come from offsite projects (i.e., virtual NEM, community solar and wholesale solar).
However, onsite development is expected to resume its position as the primary driver of development, given demand pull-in for offsite wholesale PPAs prior to the federal ITC extension. In the long term, large corporate customers’ demand for solar-plus-storage versus offsite wholesale PPAs will play a critical role in shaping the breakdown between onsite and offsite development.
Trend #3: As customer adoption ramps up in major state markets, it’s becoming harder and costlier to scale residential solar at pre-2016 levels.
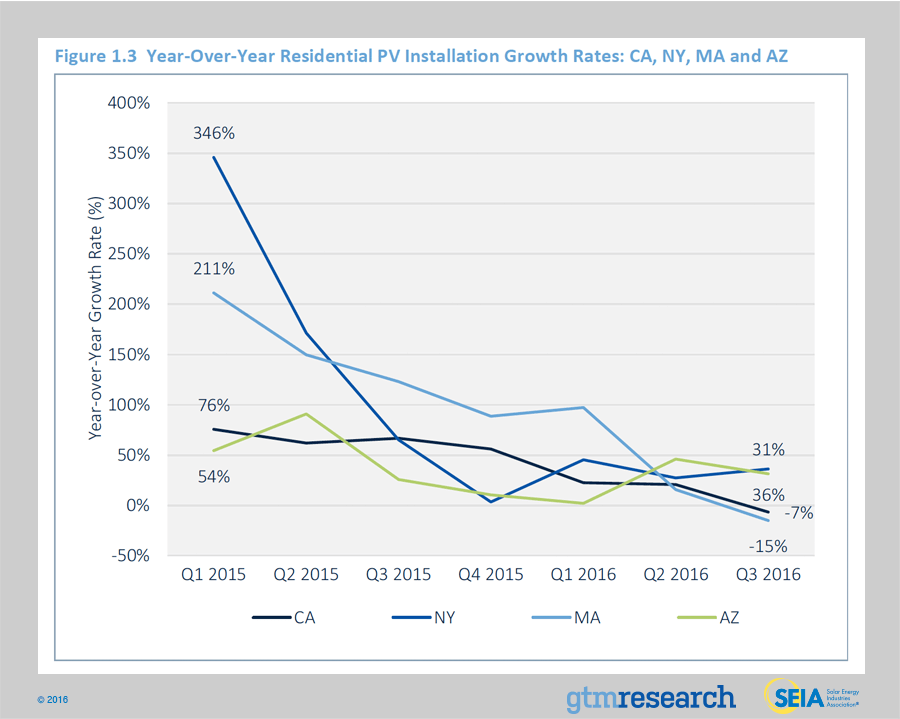
In a number of major state markets, residential solar growth rates are slowing down. The reasons behind this slowdown all center on one question: How does residential solar scale when early-adopter customers begin to deplete?
Most notably, this question is being tested in residential solar’s largest state market, California. Conversations with installers confirm that it’s becoming harder and costlier to land new leads and convert those leads into sales. As the funnel of early-adopter leads reduces, three trends within the competitive landscape compound this market fundamentals challenge.
First, a phenomenon termed “customer fatigue” has come up as a challenge in neighborhoods where homeowners are flooded with door-to-door sales pitches. Second, demand for cash sales and loans over leases and PPAs has picked up quicker than expected, and portions of the installer landscape are still playing catchup in serving this change in demand. Third, publicly traded residential solar companies have struggled to continue growing while also becoming profitable.
To be clear, GTM Research does not expect all of the above trends to be permanent problems; rather, they are signs of a segment figuring out how to grow in a maturing customer environment. Over the remainder of this decade, continued cost reductions will position nearly all states in the U.S. to move past grid parity for residential solar under current policy conditions. But scaling that demand in major and emerging state markets will not only hinge on the policy outlook (i.e., NEM and rate reform outcomes). Equally important, a reboot in growth rates will rely on evolving sales strategies that lower the cost of customer acquisition, and continued proliferation of consumer loans to serve the change in customer demand.
2. Photovoltaics

2.1 Market Segment Trends
Residential PV
Key Figures
- Down 10% from Q2 2016
- Up 2% from Q3 2015
As 2016 comes to an end, it has become clear that the national residential market is experiencing a significant slowdown as major state markets continue to see deceleration. Illustrative of this trend, California’s market fell on both a quarter-over-quarter and year-over-year basis – the latter of which is unprecedented in the state’s history and speaks to growing issues concerning market saturation and customer fatigue across California and other mature state markets.
The residential PV story is slightly different outside of the top five states. In 2016, a handful of emerging states markets – such as Utah, Texas and South Carolina – have begun to scale as national installers capture expiring incentives and early-adopter customers. That said, these states are susceptible to incentive-driven boom-and-bust cycles and the same regulatory concerns surrounding NEM that major markets have experienced in the past. Looking forward, we expect that these markets can only partially offset the deceleration seen across major states.
Non-Residential PV
Key Figures
- Up 15% from Q2 2016
- Up 37% from Q3 2015
Bolstered by a pipeline of community solar projects that has begun to come on-line this quarter, Q3 2016 was the second-largest quarter for non-residential PV, though customer-sited NEM installation levels have remained relatively flat. That said, California’s commercial sector has benefited from a growing number of projects utilizing NEM aggregation, solar-friendly commercial rate structures, and large-scale community projects. Meanwhile, major Northeast markets have seen a mixed bag this quarter. Massachusetts’ market dropped from Q2, though a large Q4 is expected due to a looming incentive expiration in January, while New York has seen a similar quarter-over-quarter decline with New Jersey remaining relatively flat.
Utility PV
Key Figures
- 4thconsecutive quarter in which utility PV added over 1 GWdc
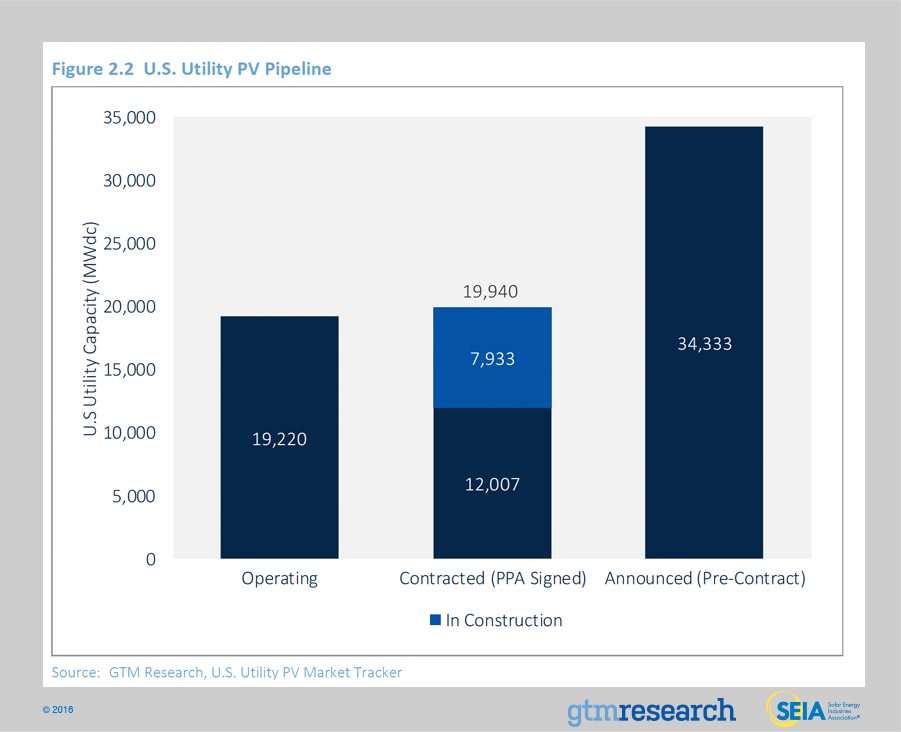
- Contracted utility PV pipeline currently totals 19.4 GWdc
The utility PV market continues to be the primary driver of installation growth in the U.S. solar market. A total of 3.2 GWdc of utility PV projects came on-line in Q3 2016, accounting for 77% of total PV capacity installed. Additionally, the market continues to see an unprecedented rate of project completion, with 4.8 GWdc of projects under construction and expecting to come on-line in Q4 2016. While a segment of these projects face interconnection and construction delay risk that would push their commercial operation date into next year, we expect 82% of projects in construction to come on-line in 2016. In fact, there are 19 projects greater than 100 MWdc expected to come on-line in Q4 2016, supporting more than 55% of the Q4 2016 outlook.
Heading into 2017, several key trends will shape the near-term utility PV market outlook. Most importantly, the 2017 outlook has increased due to additional project spillover and less evidence of project cancellation, especially in markets outside RPS mandates. A total of 55% of projects targeting 2017 operation were pushed out from 2016. Equally important, over 70% of the 2017 project pipeline comes from procurement drivers other than utilities procuring PV to meet renewable portfolio standards (RPS). Procurement via PURPA (Public Utility Regulatory Policies Act) is expected to overtake RPS as the largest driver of solar in 2017 as developers leverage avoided cost rates in North and South Carolina, Oregon and Utah. Utilities, particularly in the Southeast, continue to voluntarily procure solar to add to their portfolio as a hedge against natural gas prices. Lastly, there is a growing demand from corporate offtakers in California, Texas, and PJM markets, along with community choice aggregators (CCAs) in California. Underlying these geographic demand and procurement trends is the low-price environment for utility PV, with recent PPAs being signed at prices between $35/MWh and $50/MWh.

National Solar PV System Pricing
We utilize a bottom-up modeling methodology to track and report national average PV system pricing for the major market segments. Though we continue to solicit weighted-average system pricing directly from utility and state incentive programs, we believe that this data less accurately reflects the current state of system pricing. Systems utilizing local incentive programs constitute a minority share of the market and data from these sources often represents pricing quoted well prior to the installation and connection date.
Our bottom-up methodology is based on tracked wholesale pricing of major solar components and data collected from interviews with major installers, supplemented by data collected from utility and state programs.
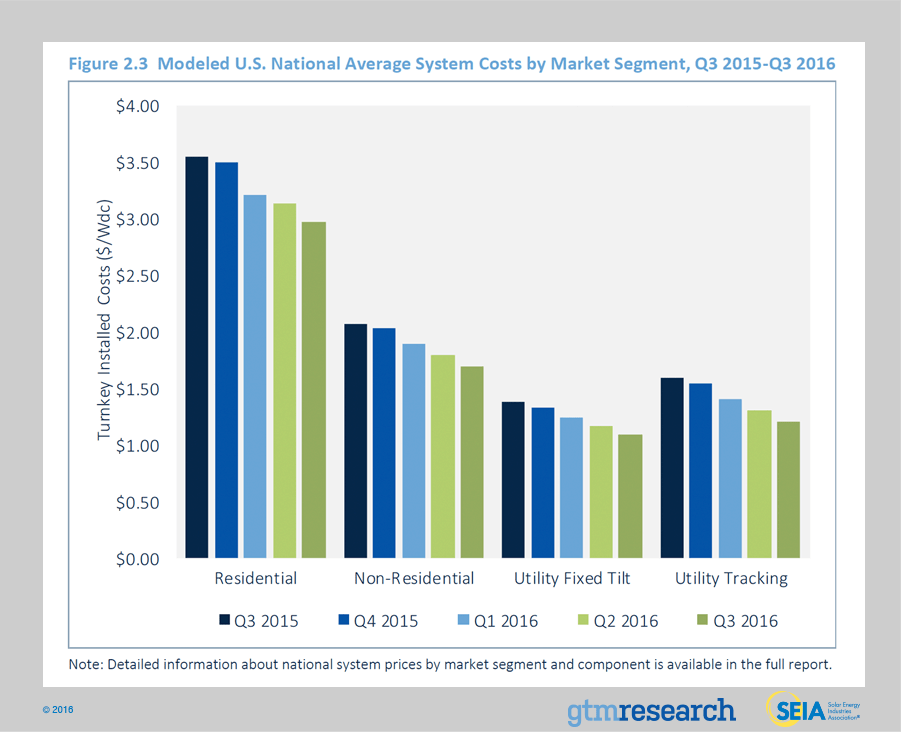
In Q3 2016, depending on the market segment, overall PV system pricing fell by up to 6.9%. The segment with the largest price decline was in the utility single-axis tracker sector. Despite rising or stagnant soft costs on a quarterly basis, total system pricing continues to trend downward across all market segments. Price declines of 5.1%, 5.6% and 6.8% occurred in the residential, non-residential and fixed-tilt utility sectors, respectively. Unprecedented price declines in modules coupled with substantial price declines in inverters and structural balance of systems spurred much of the change in systems pricing this past quarter.
In Q3 2016, average pricing for residential rooftop systems landed at $2.98/Wdc – a 5.1% drop from Q2’s $3.14/Wdc. This quarter marks the first time that residential pricing has fallen below $3.00/Wdc on a national basis. While some state markets, including Arizona, have seen pricing below $3.00/Wdc for several quarters, the broader market crossing this threshold is a historic milestone. This happened even while national and regional installers continue to report little substantial success of cutting operations and customer acquisition costs.
The non-residential sector saw a significant 5.6% fall in pricing. In Q3 2016, flat-roof non-residential system pricing landed at $1.69/Wdc from Q2’s $1.79/Wdc. Like the rest of the market, aggressive module, inverter and racking prices constituted the majority of this system pricing drop. Within the non-residential market, total hardware costs fell 13% to $0.80/Wdc. At the same time, soft costs did not change – $0.89/Wdc of total systems pricing in Q3.
Utility fixed-tilt and single-axis tracking projects in Q3 2016 saw average pricing of $1.09/Wdc and $1.21/Wdc, respectively. That represents a 6.8% and 6.9% quarterly systems price reduction. For both fixed-tilt and single-axis tracker ground-mount systems, hardware costs fell by 12% this quarter. For single-axis trackers, the cost premium over fixed-tilt is shrinking quickly. In Q2 2016, tracker systems carried a $0.13/Wdc premium over fixed-tilt systems. However, in Q3 2016 that premium shrunk to $0.12/Wdc.
Component Pricing
The dramatic decline in Q3 2016 component prices was driven by excessive component supply versus quarterly demand. This caused suppliers to aggressively slash prices and buyers to adopt “wait-and-see” strategies, which allowed prices to decline further.
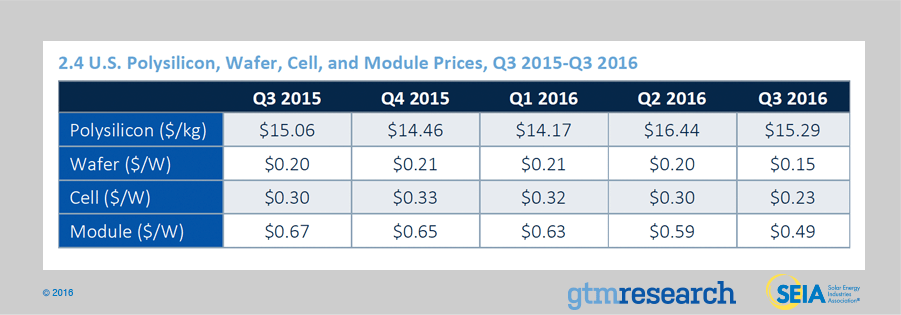
- For polysilicon, the quarterly average price fell 7% quarter-over-quarter to $15.29/kg in Q3 2016. The decrease in price was largely driven by high inventory levels, low demand for polysilicon, and pressure by PV-grade polysilicon buyers (solar wafer producers) whose prices were also on the decline.
- Wafer and cell prices fell a respective 25% and 26% quarter-over-quarter, reaching $0.15/W and $0.23/W in Q3 2016. The same dynamics driving lower polysilicon prices also drove rapid decline in solar wafer and cell prices. In addition, lower input costs allowed for further price depreciation.
- In the past few years, U.S. module price trends were largely driven by antidumping and countervailing duties on Chinese suppliers. But recently the main driver has shifted; current module price trends are largely a result of supply-demand imbalance, with prices continuing to slump at accelerating rates. During the third quarter, the quarterly average delivered price for Chinese producers ranged from $0.47/W on the low side (corresponding to order volumes greater than 10 MW for less established firms) to $0.49/W on the high side (established firms; order volumes of less than 1 MW).

Market Outlook
Just 12 months ago, Congress passed an omnibus spending bill that included a multiyear extension of the federal Investment Tax Credit. Without question, the extension of the federal ITC ranks as the most important policy development for U.S. solar in years. Between 2016 and the end of the decade, the ITC extension will spur nearly 20 GWdc of additional PV capacity, positioning U.S. solar to remain a double-digit gigawatt annual market heading into the next decade.
Given the timing of the federal ITC extension, however, Q4 2016 remains on track to be a record quarter that results in more than 10 GWdc of utility PV brought on-line on an annual basis. Amidst GTM Research’s review of all utility PV projects in development, it’s important to note that there is a substantial degree of project spillover. A total of 2.4 GWdc of projects under construction have pushed out interconnection into early 2017, and more than 3 GWdc of additional capacity not in construction has pushed out interconnection into next year too. With that in mind, GTM Research has arrived at a 4.8 GWdc utility-scale forecast for Q4 primarily due to the following trend.
Publicly traded solar independent power producers (IPPs) have elected to interconnect all or an overwhelming majority of their original 2016 pipelines in H2 2016.
The reasons behind this decision vary, ranging from certain IPPs having substantial tax equity appetite for 2016 to advanced construction timelines that proceeded in Q4 2015 through H1 2016 despite the federal ITC extension. In Q3 2016, 21 projects or project phases greater than 50 MWdc came on-line, largely from public IPPs. In Q4 2016, GTM Research has confirmed an additional 40 projects or project phases larger than 50 MWdc that remain on track to come on-line this year.
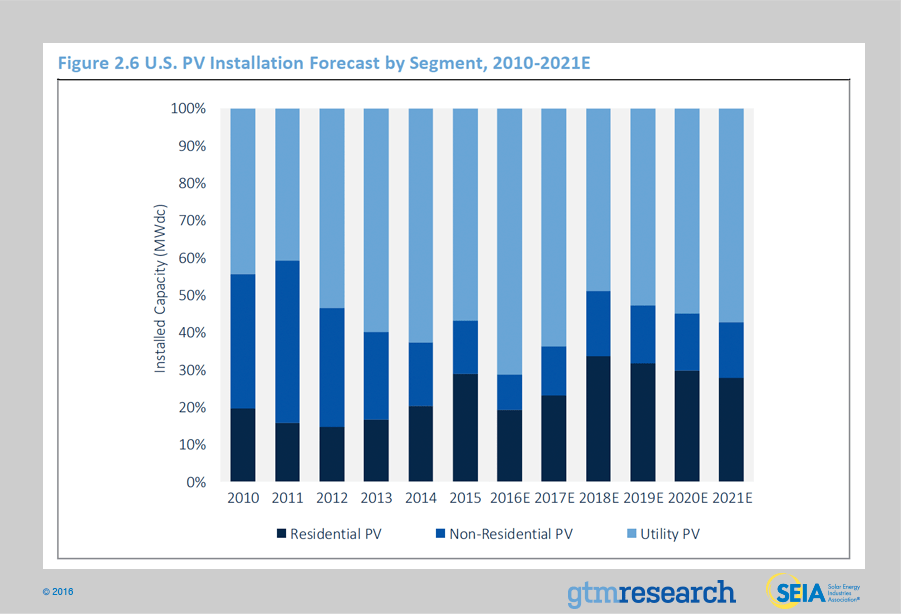
In 2017, while the residential and non-residential PV markets are both expected to grow year-over-year, the U.S. solar market is expected to drop just over 4% on an annual basis. Flat demand in 2017, a departure from the declines presented in previous forecasts, is due to the growing number of utility PV projects that have pushed out completion dates from the second half of this year into 2017. As mentioned, the extension of the federal ITC has enabled nearly 6 GWdc of utility PV to spill over into 2017, providing utilities with necessary breathing room to interconnect the 8 GWdc pipeline of utility PV currently under construction.
By 2019, U.S. solar is expected to resume year-over-year growth across all market segments. And by 2021, 30 states in the U.S. will be 100+ MWdc annual solar markets, with 20 of those states home to more than 1 GWdc of operating solar PV.
Forecast details by state (39 states plus Washington, D.C.) and market segment through 2021 are available in the full report.

Acknowledgments
U.S. Solar Market Insight® is a quarterly publication of GTM Research, a Wood Mackenzie Business, and the Solar Energy Industries Association (SEIA)®. Each quarter, we collect granular data on the U.S. solar market from nearly 200 utilities, state agencies, installers and manufacturers. This data provides the backbone of this U.S. Solar Market Insight® report, in which we identify and analyze trends in U.S. solar demand, manufacturing and pricing by state and market segment. We also use this analysis to look forward and forecast demand over the next five years. All forecasts are from GTM Research, a Wood Mackenzie Business; SEIA does not predict future pricing, bid terms, costs, deployment or supply.
- References, data, charts and analysis from this executive summary should be attributed to “GTM Research, A Wood Mackenzie Business/SEIA U.S. Solar Market Insight®.”
- Media inquiries should be directed to Mike Munsell ([email protected]) at GTM Research and Alexandra Hobson ([email protected]) at SEIA.
- All figures are sourced from GTM Research, a Wood Mackenzie Business. For more detail on methodology and sources, visit www.gtmresearch.com/solarinsight.
Our coverage in the U.S. Solar Market Insight reports includes 39 individual states and Washington, D.C. However, the national totals reported include all 50 states, Washington, D.C., and Puerto Rico.
Detailed data and forecasts for 39 states and Washington, D.C. are contained within the full version of this report, available at www.greentechmedia.com/research/ussmi.
Author’s Note: Revision to U.S. Solar Market Insight report title
GTM Research and SEIA have changed the naming convention for the U.S. Solar Market Insight report series. Starting with the report released in June 2016 onward, the report title will reference the quarter in which the report is released, as opposed to the most recent quarter in which installation figures are tracked.
AUTHORS
GTM Research | U.S. Research Team
Cory Honeyman, Associate Director of U.S. Solar (lead co-author)
Austin Perea, Solar Analyst (lead co-author)
Shayle Kann, Senior Vice President
MJ Shiao, Director of Solar Research
Jade Jones, Senior Solar Analyst
Colin Smith, Solar Analyst
Benjamin Gallagher, Solar Analyst
Scott Moskowitz, Solar Analyst
Allison Mond, Solar Analyst
Solar Energy Industries Association | SEIA
Shawn Rumery, Director of Research
Aaron Holm, Data Engineer
Katie O’Brien, Research Associate
Justin Baca, Vice President of Markets & Research