Solar Market Insight Report 2016 Q3
Purchase the Full Report | Press Release
The quarterly SEIA/GTM Research U.S. Solar Market Insight™ report shows the major trends in the U.S. solar industry. Learn more about the U.S. Solar Market Insight Report.
Key Figures
- The U.S. installed 2,051 MWdc of solar PV in Q2 2016, increasing 43% over Q2 2015.
- In the first half of 2016, solar accounted for 26% of all new electric generating capacity brought on-line in the U.S.
- Installing 650 MWdc, residential PV grew only slightly over Q1 2016 but had its largest quarter ever while growing 29% year over year.
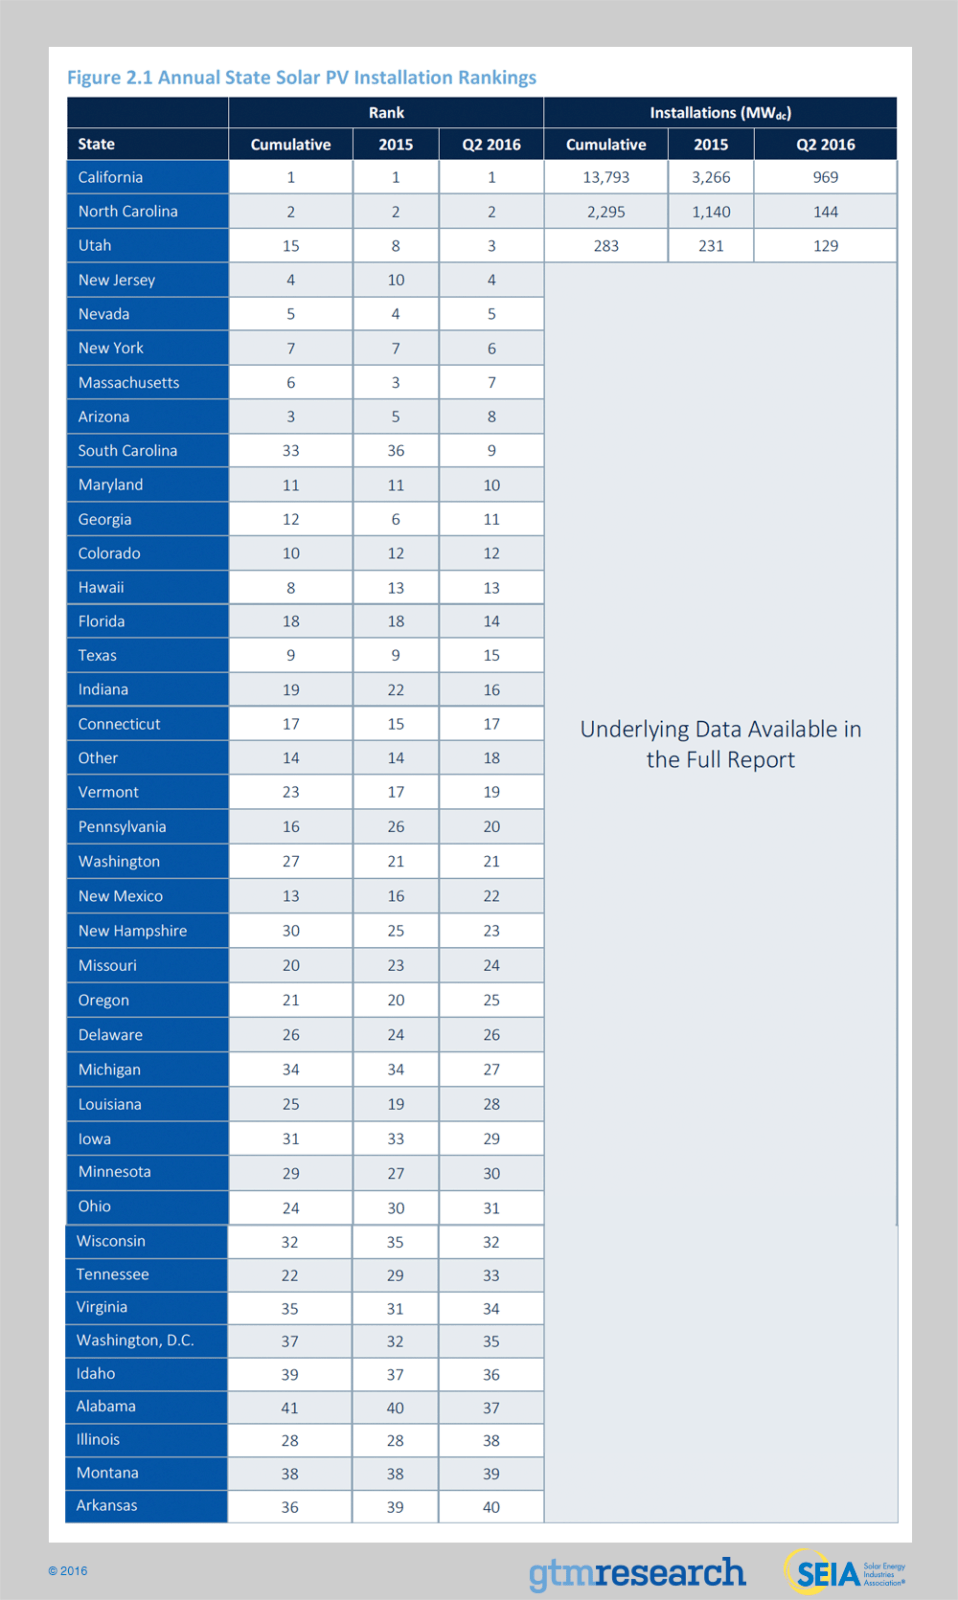
- California accounted for 42% of rooftop PV installations in Q2 – its lowest share since Q4 2012 – as markets in states like Utah and Texas begin to account for larger shares of the residential segment.
- While only 7 states added more than 25 MW of rooftop PV in the first half of 2015, 11 states added more than 25 MW over the same period in 2016, continuing a trend of geographic demand diffusion.
- Despite adding less than 10 MW in Q2, community solar is expected to add 100 MW in 2016.
- Over a gigawatt of utility-scale solar was installed for the third consecutive quarter as that segment continues to build out more than 7.8 GWdc of additional projects expected to come online in 2016.
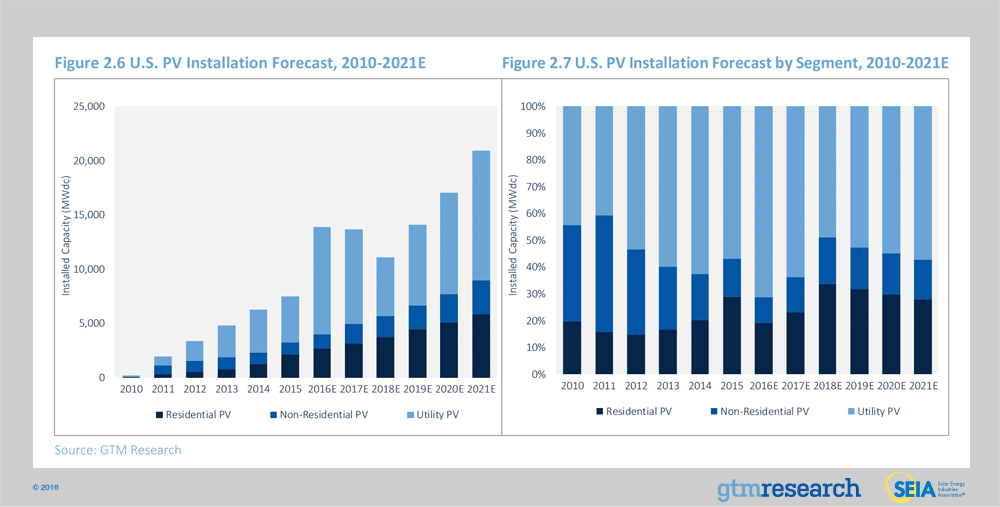
- GTM Research forecasts that 13.9 GWdc of new PV installations will come on-line in 2016, up 85% over 2015. Utility PV is expected to drive the majority of demand, accounting for over 70% of new capacity.
1. Introduction
In Q2 2016, the U.S. solar market installed 2,051 megawatts direct current (MWdc), up 43% over Q2 2015. In addition to adding more than 1 GWdc for the eleventh consecutive quarter, for the first time ever, the U.S. added more than 2 GWdc on a quarterly basis in a quarter other than Q4. This record-breaking installation total marks the beginning of an unprecedented wave of growth that will occur throughout the remainder of 2016, specifically within the utility PV segment. With more than 10 GWdc of utility PV currently under construction, the second half of this year and the first half of 2017 are on track to continue setting new records for solar capacity additions.
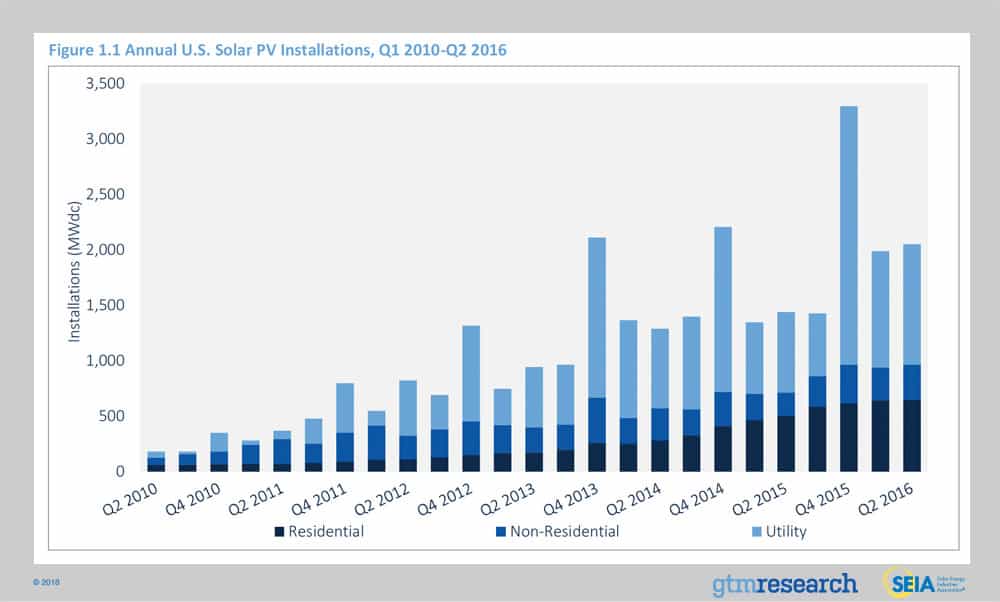
When accounting for all projects (both distributed and centralized), solar ranked as the second-largest driver of capacity additions across all fuel types in the U.S., accounting for 26% of all new electric generating capacity installed in the first half of 2016. During that same stretch, new storylines across each segment emerged that will not only shape the next 12 months, but which have also raised questions about the long-term drivers of continued growth.
- Utility PV: The timing of the federal ITC extension in December 2015 has complicated the development timeline for the more than 18.5 GWdc of utility PV installations that would have attempted to interconnect in 2016 had the ITC not been extended. While 7.8 GWdc are expected to come on-line in 2H 2016, 5.7 GWdc will spill over into 2017 and an additional 3 GWdc will be pushed out beyond 2017. In turn, more than 65% of the 2017 utility PV installation forecast is expected to stem from project spillover.
- Non-residential PV: For the non-residential PV segment, the major state markets are transitioning toward more diversity in types of project development. Self-consumption projects that avoid system-size limits set under net metering programs and new community solar programs are countering continued weakness in the non-residential rooftop solar. Most notably, community solar programs in California and the Northeast are on track to drive over 100 MWdc of community solar for the first time ever on an annual basis.
- Residential PV: The residential solar market is experiencing different storylines across major and emerging state markets. In a handful of emerging state markets, quarterly growth rates are spiking as national installers tap into new regions that have reached grid parity, where the cost of customer acquisition remains cheap given the plethora of early-mover customers. Meanwhile, major state markets are continuing to grow, but at much slower rates compared to the past few years. Conversations with some installers suggest that the cost and length of customer acquisition are increasing as fewer early mover customers remain, and this challenge is limiting growth, especially in California.
But the definition and scope of an “early mover” customer remains subjective. Equally important, it remains unclear whether customer acquisition challenges are a symptom of a dwindling pool of early mover customers, and whether evolving customer demographics is actually contributing to California’s recent slowdown in demand.
The figure below compares year-over-year residential PV installation growth rates by quarter in California (left y-axis) with each percentage increase in California’s residential rooftop PV addressable market installed (x-axis). GTM Research calculates the addressable market based on cumulative residential PV systems installed as a percentage share of owner occupied homes (U.S. Census Bureau) that have suitable rooftop space for solar (national estimate from NREL).
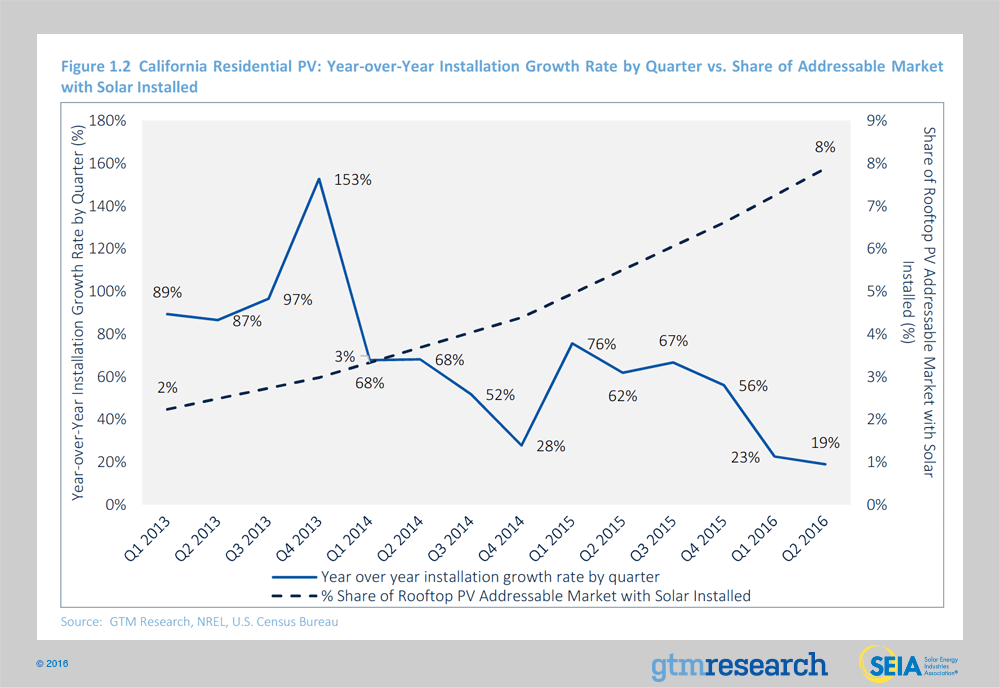
As the above figure reveals, California experienced hockey-stick levels of growth up through 2013, when California’s solar economics penciled out without state incentive funding and less than 3% of the state’s addressable market had installed rooftop solar. Then, growth rates began to slow in 2014 after eclipsing 3% customer penetration. And while 2015 quarterly growth rates did increase in California, as customers rushed to install amidst federal ITC uncertainty, growth rates during the first half of 2016 have dropped back down to 2014 levels.
Whether or not it’s coincidental, the time and cost of customer acquisition have increased in tandem with a reduction in installation growth beyond 3% customer penetration.
On one hand, the localized nature of the rooftop PV market means that there isn’t a simple, single answer that explains a slowdown in the nation’s largest rooftop PV market. But under GTM Research’s base case forecast, California is on track to install well over 25% of its addressable residential PV market by 2021.
So whether or not it has happened already, California’s position as the largest residential PV market means it will be one of the first state markets to expand beyond early mover customer demographics. In turn, the state will provide the rest of the U.S. with an important precedent for how rooftop solar can continue to scale in a more mature market, as new customer acquisition tactics are tested and loans regain market share.
The challenges and growth opportunities of a more mature customer landscape is a trend that is impacting the non-residential and utility PV markets too. Non-residential customers are increasingly seeking more than just rooftop solar; rather, many are looking for broader integrated energy management solutions that include storage or offsite, large-scale solar. Meanwhile, as utility PV PPA pricing dips below $60/MWh, and in some areas, $50/MWh, procurement opportunities are expanding beyond renewable portfolio standards into non-RPS solicitations that recognize solar’s cost-competitiveness with natural-gas alternatives in long-term resource plans.
Considering the long-term certainty surrounding the federal ITC, three new questions have come to the forefront and will shape the long-term outlook for U.S. solar:
- How does rooftop solar scale beyond early adopters in mature state markets?
- Can non-residential solar grow as part of a broader energy management solution?
- To what extent can non-RPS-driven procurement counter and fill in the gaps left behind by utilities ahead of their RPS obligations?
The above questions are not the only themes expected to define the future of U.S. solar, but they have come to the forefront in 2016 and will play critical roles in the long-term outlook heading into the next decade.
In the meantime, 2016 remains on track to see the installation of a record 13.9 GWdc, with utility PV accounting for over 70% of that annual total. With the federal ITC extended through 2021, and a “commence-construction” rule added, market participants benefit from federal-level policy visibility through 2023. Building off that policy certainty, U.S. solar is expected to remain a double-digit gigawatt annual market through the remainder of this decade. The extent to which it exceeds current projections hinges on the growth of non-RPS utility PV procurement, as well as distributed solar’s ability to grow in a more fragmented rate design and net metering policy landscape.
2. Photovoltaics

Market Segment Trends
Residential PV
Key Figures
- Up 1% over Q1 2016
- Up 29% over Q2 2015
Despite residential PV growing on a quarter-over-quarter basis, halfway into the year, we are beginning to see signals of demand moderation for rooftop solar across many major state markets. What was thought to be seasonal decline in installation volumes in Q1 in major markets has continued into Q2, resulting in an average growth rate of 3% in H1 2016 compared to 11% in H1 2015. Conversely, several emerging state markets have been picking up steam in H1 2016, helping to offset slower growth in major state markets.
In particular, demand slowdown in California has had a noticeable impact on national installation levels. In Q2 California accounted for only 42% of national residential installations – the state’s smallest market share since Q4 2012.
California’s slowdown in growth is part of a handful of top 10 state markets that have experienced flat quarterly growth. That said, NEM reforms will continue to play a role in PV adoption. For instance, Arizona continues to see high levels of installation growth in response to APS’ proposed rate reform that would slash solar savings. Looking forward, we expect emerging state markets such as Utah and Texas – both of which will be 50+ MW residential markets in 2016 – to begin to compensate for slowing growth in major states.
Non-Residential PV
Key Figures
- Up 5% from Q1 2016
- Up 49% over Q2 2015
Continuing the trend of Q1 2016, growth in the non-residential PV segment remains constrained on a national level primarily due to weakness in Northeast markets, where expiring incentive programs, protracted debates about NEM cap extensions, and the status and value of virtual net metering have hindered certain commercial sub-segments. Across the major state markets, New Jersey and New York have been able to buck this trend this quarter, though Massachusetts and Maryland were both down from Q1. That said, California’s commercial market was a clear bright spot in Q2, accounting for over 50% of commercial installed capacity on a record-high quarter, helping to offset weakness in other markets.
While we expect community solar to provide an attractive growth opportunity for non-residential developers moving forward, the non-residential space is still struggling to scale across particular sub-segments, including small-scale, unrated industrial C&I customers. Rollbacks to the value of virtual NEM and persistent SREC oversupply in many major state markets continue to slow demand in several states.
Utility PV
Key Figures
- 3rd consecutive quarter in which utility PV added over 1 GWdc
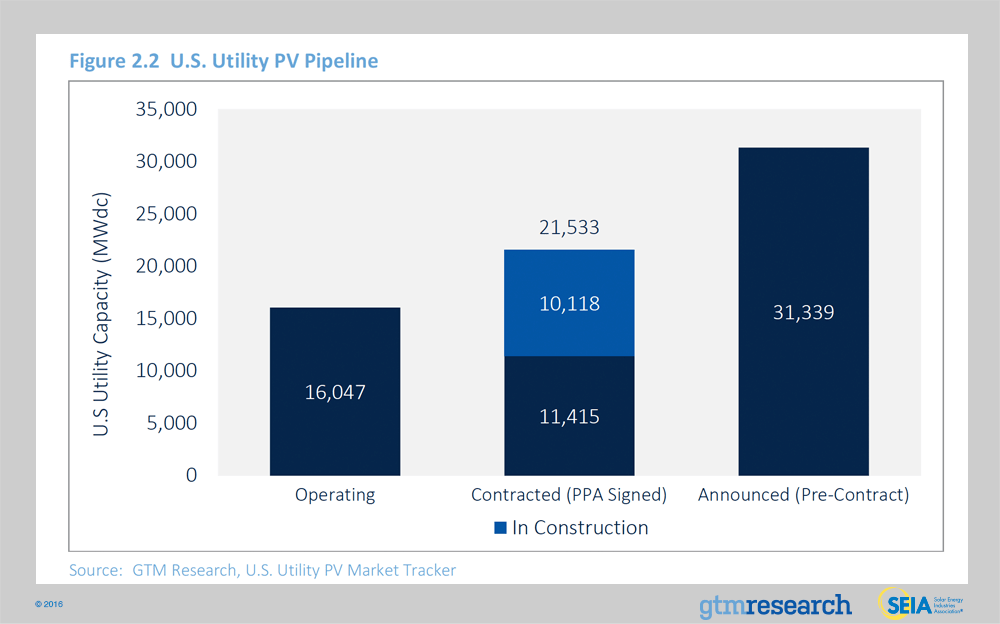
- Contracted utility PV pipeline currently totals 21.5 GWdc
The utility PV market continues to serve as the bedrock driver of installation growth in the U.S. solar market, accounting for 53% of capacity installed in H1 2016. The market is on the verge of an unprecedented rate of project completion. Currently, 7.8 GWdc worth of projects in development are under construction and are expected to come on-line before the end of 2016. Consequently, the second half of 2016 will see almost as much capacity come on-line than as all of 2014 and 2015 combined. In the first five weeks of Q3, over 750 MWdc have already come on-line. While 2016 is expected to see a cumulative 9.9 GWdc come on-line, developers have continued to push out more project completion dates into 2017 due to the federal ITC extension.
Several key trends that will shape the near-term utility PV market outlook include continued growth of utility PV outside of renewable portfolio standard (RPS) obligations and increased procurement by municipal and cooperative utilities. 2017 installation volume will be dictated largely by project spillover, with over 65% of projects having been pushed out from 2016. However, over 75% of greenfield origination for 2017 will come from non-RPS projects. While 10 states have 200 MWdc or more operating, 22 states now have 200 MWdc or more in development. This is in part driven by utilities in both major and emerging markets procuring solar as a hedge against natural-gas price volatility. Underlying these geographic demand and procurement trends is the low price environment for utility PV, with recent PPAs being signed at prices between $35/MWh and $50/MWh.
National Solar PV System Pricing
We use a bottom-up modeling methodology to track and report national average PV system pricing for the major market segments. Though we continue to solicit weighted-average system pricing directly from utility and state incentive programs, we believe that this data less accurately reflects the current state of system pricing. Systems utilizing local incentive programs constitute a minority share of the market, and data from these sources often represents pricing quoted well prior to the installation and connection date.
Our bottom-up methodology is based on tracked wholesale pricing of major solar components and data collected from interviews with major installers, supplemented by data collected from utility and state programs. These numbers reflect price quotes provided over the last quarter.

In Q2 2016, overall system pricing fell by up to 7.5%, depending on the market segment, with the largest declines in the utility tracking sector. On a quarterly basis, pricing continues to trend downward across all market segments. Price declines of 2.2%, 5.3% and 5.5% occurred in the residential, non-residential and fixed-tilt utility sectors, respectively. Major cost declines in modules, inverters and racking spurred much of the change in system pricing this past quarter.
In Q2 2016, average pricing for residential rooftop systems landed at $3.14/Wdc, with nearly 65% of costs coming from on-site labor, customer acquisition and other soft costs. While residential hardware costs fell by over 7% in the past quarter, total soft costs rose 0.5%. Though engineering and labor costs did fall in the past quarter, once again, customer acquisition costs rose. And even as residential solar installations stagnated in many of the traditional solar markets (e.g., California and Massachusetts), competition to attract customers increased. With uncertain policy dynamics, residential installers could see their customer acquisition costs continue to rise next quarter.
In Q2, the non-residential sector also saw a significant 5.3% overall decline in pricing. Aggressive module, inverter and racking prices constituted the majority of this drop: total hardware costs fell 9% quarter-over-quarter while soft costs decreased 2%. Though soft costs make up 50% of total system pricing, on a yearly basis, they have fallen by 13%. Despite the variety of challenges for attracting customers in the non-residential market, engineering, procurement and construction (EPC) providers are successfully reducing their on-site installation time, design costs and minimizing overhead.
Utility fixed-tilt and tracking projects in Q2 2016 saw an average pricing of $1.17/Wdc and $1.30/Wdc, respectively. Within both fixed-tilt and tracker ground-mount systems, hardware costs fell by 9% this quarter. As hardware costs make up approximately 70% of utility PV systems pricing, this market segment is most sensitive to dynamics in the hardware markets. The cost premium of tracking systems over fixed tilt is shrinking quickly. In Q1 2016, tracker systems carried a $0.17/Wdc premium over fixed-tilt systems. However, in Q2 2016 that premium shrunk to $0.13/Wdc. Similar changes in hardware pricing should continue for the remainder of 2016, making utility projects a market segment to watch for rest of the year.
Component Pricing
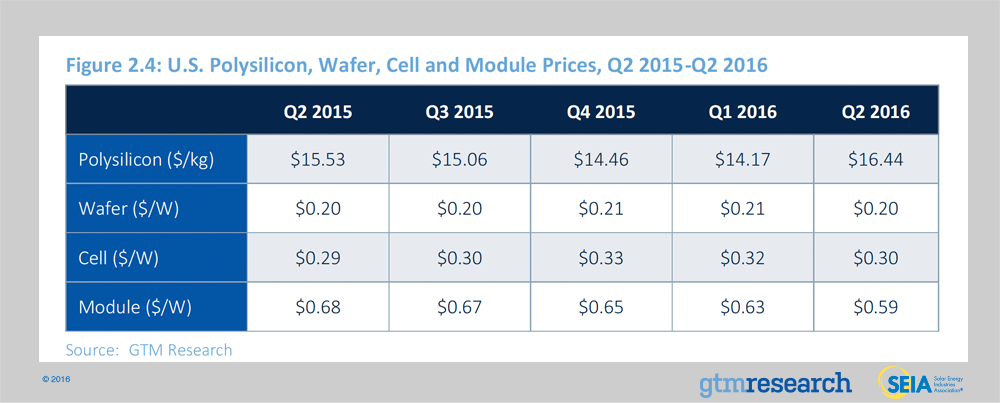
Prices in Q2 2016 were driven by seasonally weak downstream demand and component- level inventories.
- For polysilicon, the quarterly average price increased 16% to $16.44/kg in Q2 2016. The increase in price was largely driven by relatively low inventory levels.
- Wafer and cell prices fell, reaching $0.20/W and $0.30/W, respectively, in Q2 2016. Prices for these components were driven by weakened downstream demand and price pressure from module manufacturers.
U.S. module prices are heavily influenced by antidumping and countervailing duties imposed on Chinese suppliers. In July 2016, the U.S. Department of Commerce filed its final review of the import tariffs on Chinese cells into the U.S. market. The final ruling set the cumulative duty at 29.46% for most major suppliers (Yingli: 33.13%; Trina 25.32%, and JA Solar: 27.72%). During the second quarter, the average delivered price for Chinese modules ranged from $0.58/W on the low side (corresponding to order volumes greater than 10 MW for less established firms) to $0.60/W on the high side (established, bankable firms; order volumes of less than 1 MW).

Market Outlook
In December 2015, Congress passed an omnibus spending bill that included a multiyear extension of the federal Investment Tax Credit. Without question, the extension of the federal ITC ranks as the most important policy development for U.S. solar in years. Between this year and the end of the decade, the ITC extension will spur more than 20 GWdc of additional PV capacity, positioning U.S. solar to become a 21 GWdc annual market by 2021.
Looking ahead, the federal ITC will remain at 30% through 2019, and then step down to 26% in 2020 and 22% in 2021. In 2022, it will step down to 10% for third-party-owned residential, non-residential, and utility PV projects (which use the section 48 credit), while expiring entirely for direct-owned residential PV (section 25d credit). Equally important, projects eligible for the section 48 credit that commence construction but do not interconnect in the years 2019, 2020 and 2021 can qualify for correspondingly larger tax credits if they come on-line by the end of 2023.
Given the timing of the federal ITC extension, however, the wheels are already in motion for U.S. solar to benefit in 2016 from more than 9 GWdc of late-stage utility PV projects that rushed through development last year. In turn, we expect another record year for the U.S. PV market in 2016, with installations reaching 13.9 GWdc, an 85% increase over 2015.
However, with an unprecedented 10 GWdc of utility PV capacity currently in construction, there remains substantial upside and downside risk to our utility PV outlook. The following figure visualizes the status of the utility PV pipeline in late-stage development, which shows more than 2 GWdc of upside and downside potential that hinge on unique construction and interconnection timelines over the next several months.
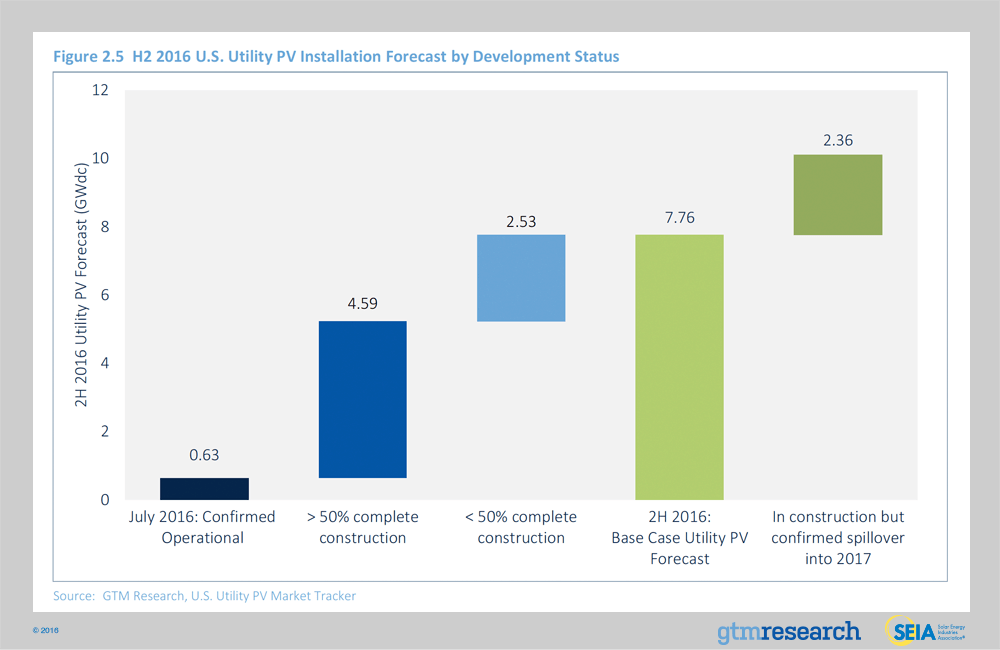
Of the total in our H2 2016 base-case utility PV forecast, 8% came on-line in July 2016 and 59% is more than 50% under construction. The remaining 2.5 GWdc is under construction but less than 50% complete (as of August 2016). In addition to the 7.8 GWdc forecasted for 2H 2016, another 2.4 GWdc is under construction, but developers and utilities expect it to spill over into 2017. In a downside scenario, additional capacity at less than 50% complete construction could push out into 2017. Meanwhile, in an upside scenario, a portion of the 2.4 GWdc under construction could ultimately squeeze into December 2016 if interconnection timelines exceed expectations, especially for individual phases of large-scale projects greater than 50 MWdc.
In 2017, while the residential and non-residential PV markets are both expected to grow year-over-year, the U.S. solar market is expected to drop just under 2% on an annual basis. Flat demand in 2017, a departure from the declines presented in previous forecasts, is due to the growing number of utility PV projects that have pushed out completion dates from the second half of this year into 2017. Including the aforementioned spillover of projects in construction, the extension of the federal ITC has enabled nearly 6 GWdc of utility PV to spill over into 2017, providing utilities with necessary breathing room to interconnect a double-digit-gigawatt pipeline of utility PV currently under construction.
By 2019, U.S. solar is expected to resume year-over-year growth across all market segments. And by 2021, more than 30 states in the U.S. will be 100+ MWdc annual solar markets, with 20 of those states home to more than 1 GWdc of operating solar PV. Forecast details by state (39 states plus Washington, D.C.) and market segment through 2021 are available in the full report.
Acknowledgments
U.S. Solar Market Insight® is a quarterly publication of GTM Research, A Wood Mackenzie Business and the Solar Energy Industries Association (SEIA)®. Each quarter, we collect granular data on the U.S. solar market from nearly 200 utilities, state agencies, installers and manufacturers. This data provides the backbone of this U.S. Solar Market Insight® report, in which we identify and analyze trends in U.S. solar demand, manufacturing and pricing by state and market segment. We also use this analysis to look forward and forecast demand over the next five years. All forecasts are from GTM Research, A Wood Mackenzie Business; SEIA does not predict future pricing, bid terms, costs, deployment or supply.
- References, data, charts and analysis from this executive summary should be attributed to “GTM Research, A Wood Mackenzie Business/SEIA U.S. Solar Market Insight®.”
- Media inquiries should be directed to Mike Munsell at GTM Research, A Wood Mackenzie Business and Alexandra Hobson at SEIA.
- All figures are sourced from GTM Research, A Wood Mackenzie Business. For more detail on methodology and sources, visit www.gtmresearch.com/solarinsight.
Our coverage in the U.S. Solar Market Insight reports includes 39 individual states and Washington, D.C. However, the national totals reported include all 50 states, Washington, D.C., and Puerto Rico.
Detailed data and forecasts for 39 states and Washington, D.C. are contained within the full version of this report, available at www.greentechmedia.com/research/ussmi.
AUTHORS
GTM Research | U.S. Research Team
Shayle Kann, Senior Vice President
MJ Shiao, Director of Solar Research
Cory Honeyman, Associate Director of U.S. Solar (lead co-author)
Austin Perea, Solar Analyst (lead co-author)
Jade Jones, Senior Solar Analyst
Colin Smith, Solar Analyst
Benjamin Gallagher, Solar Analyst
Scott Moskowitz, Solar Analyst
Solar Energy Industries Association | SEIA
Justin Baca, Vice President of Markets & Research
Shawn Rumery, Director of Research
Aaron Holm, Data Engineer
Katie O’Brien, Research Associate