September 12, 2016
Sponsored by Morgan Lyons
A New SMI Report? Must Mean More Growth for the Solar Industry!
It seems like clockwork at this point. With each new Solar Market Insight report, the solar industry sees more historic growth, and this new report from GTM Research and SEIA is no different.
The solar industry installed 2,051 megawatts of PV in Q2 2016, bringing the total nationwide capacity to 31.6 gigawatts (see Figure 1.1 below) and making this quarter the best non-quarter 4 ever for the industry. There is now enough solar installed to power more than 6.2 million U.S. homes and reduce carbon emissions by 37 million metric tons each year.

A new solar installation was completed every 82 seconds in the first half of 2016, equaling over 1,000 installs every day. This frequency is what will take the current total of 1.1 million solar systems, which took 40 years to reach, to 2 million systems by 2018.
The outlook for the rest of 2016 is just as eye-opening. The industry expects to add 13.9 GW of new capacity, which would be an 85 percent growth rate over 2015, solar’s largest year ever. The U.S added 4 GW of capacity in the first half of 2016, but the industry will add nearly 10 GW in the final 6 months, which is 34 percent more than was installed in all of 2015, a record year!
The industry is growing faster than ever, and here is what else we saw in this SMI report:
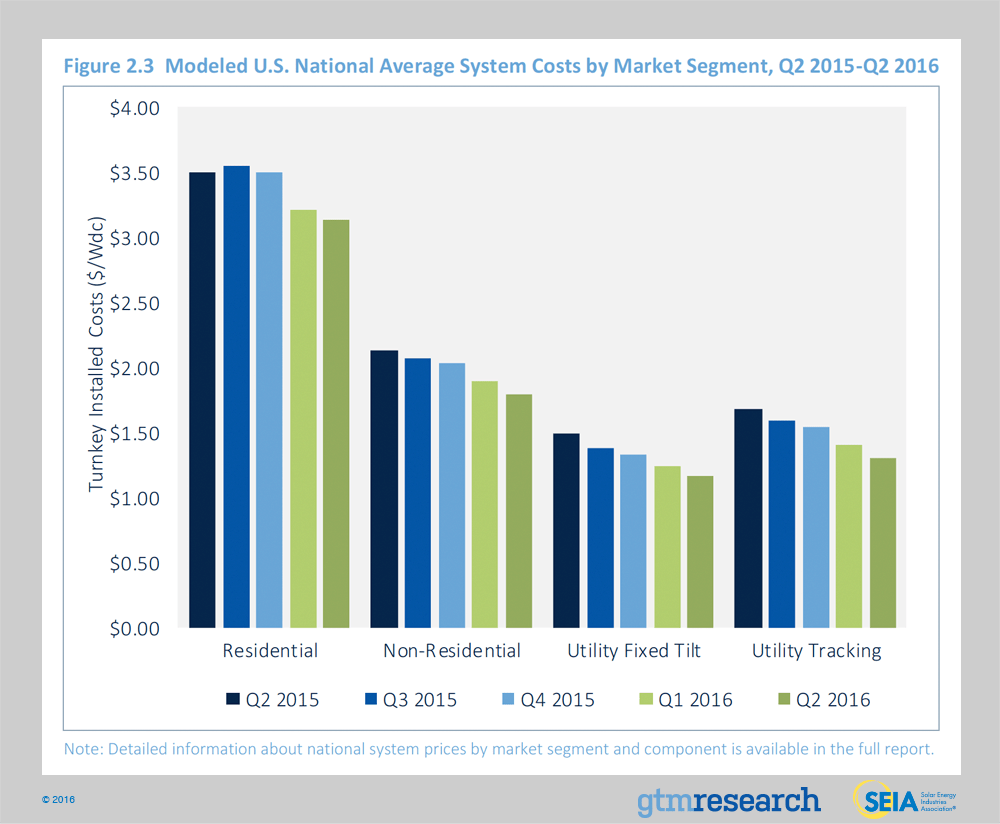
- Solar prices fell across all market segments, with declines ranging from 2-7 percent (see Figure 2.3)
- As a whole, the price of solar is 18 percent lower than it was one year ago, and 63 percent lower than it was 5 years ago.
- Solar represented 26 percent of all new electric generating capacity brought online in the first half of 2016.
- There are now 1,162,000 individual solar systems installed in the U.S., including more than a million residential systems.
- The utility-scale sector installed over 1 GW for the 3rd consecutive quarter, and will install nearly 10 GW by the end of this year.
- Thanks to strong growth by non-traditional markets like Texas and Utah, the residential sector experienced another record quarter, installing 650 MW.

The Q3 Solar Market Insight Report provides a clear vision of where the solar industry stands today, and where we’re headed in the future. By 2021, the industry is projected to nearly quadruple, while more than doubling its employment numbers and generating billions in investment. The state of solar is strong, and the potential for future growth is even more encouraging.

