How The Shift To Solar Is Making History

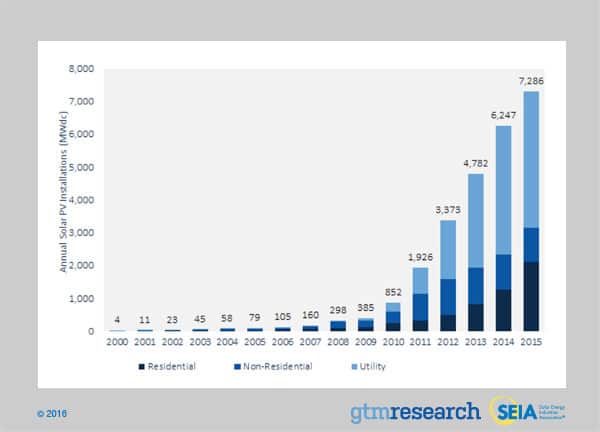
It's official. Solar energy has made history. In 2015, America experienced the largest increase in solar photovoltaic (PV) capacity we've ever seen. Solar now provides 1 percent of all the electricity generated in the U.S.— up from 0.1 percent in 2010.
It’s official. Solar energy has made history.
In 2015, America experienced the largest increase in solar photovoltaic (PV) capacity we’ve ever seen. Solar now provides 1 percent of all the electricity generated in the U.S.—Â up from 0.1 percent in 2010.
This is only the beginning of solar’s skyrocketing trajectory.
Records Broken In 2015
- The U.S. installed nearly 7.3 gigawatts (GW) of solar PV, the largest yearly total ever.
- Solar beat out natural gas capacity additions for the first time ever, supplying 29.5 percent of all new electric generating capacity in the U.S.
- Total residential solar capacity surpassed more than 2 GW for the first time ever.
- Utility-scale solar PV installed more than 4 GW for the first time ever.
- Prices in all market segments reached their lowest points ever.
- There are now more states than ever (6) with more than 1 GW of installed solar capacity.
- Total cumulative U.S. solar PV capacity topped 25 GW for the first time.
Over the next few years, solar will reach unprecedented heights as we make a shift toward carbon-free and economically-viable sources. The increasing shift to solar, and other carbon-free sources, has already contributed to the lowest level of carbon emissions produced by the U.S. power sector since 1995.
Stay tuned for more historic figures and forecasts on March 9, when GTM and SEIA release the U.S. Solar Market Insight Year-In-Review report.

