Solar Market Insight Report 2022 Q2
The quarterly SEIA/Wood Mackenzie Power & Renewables U.S. Solar Market InsightTM report shows the major trends in the U.S. solar industry. Learn more about the U.S. Solar Market Insight Report. Released June 7, 2022.
Important note: This edition of the US Solar Market Insight report contains forecast scenarios based on different policy environments, particularly the US Department of Commerce anti-circumvention investigation initiated in late March. After these scenarios were finalized, the Biden administration announced 1) a two-year delay of new AD/CVD tariffs on solar cells and modules imported to the US from Cambodia, Malaysia, Thailand, and Vietnam, and 2) authorization of the Defense production Act in support of domestic solar manufacturing. Given this news, our Base case outlook reflects our current view of industry expectations, with a few gigawatts of upside potential to 2022 installations.
The details of these events are evolving rapidly. It is critical to note the specific assumptions for each scenario (detailed in the report) as context for interpreting the results.
1. Key Figures
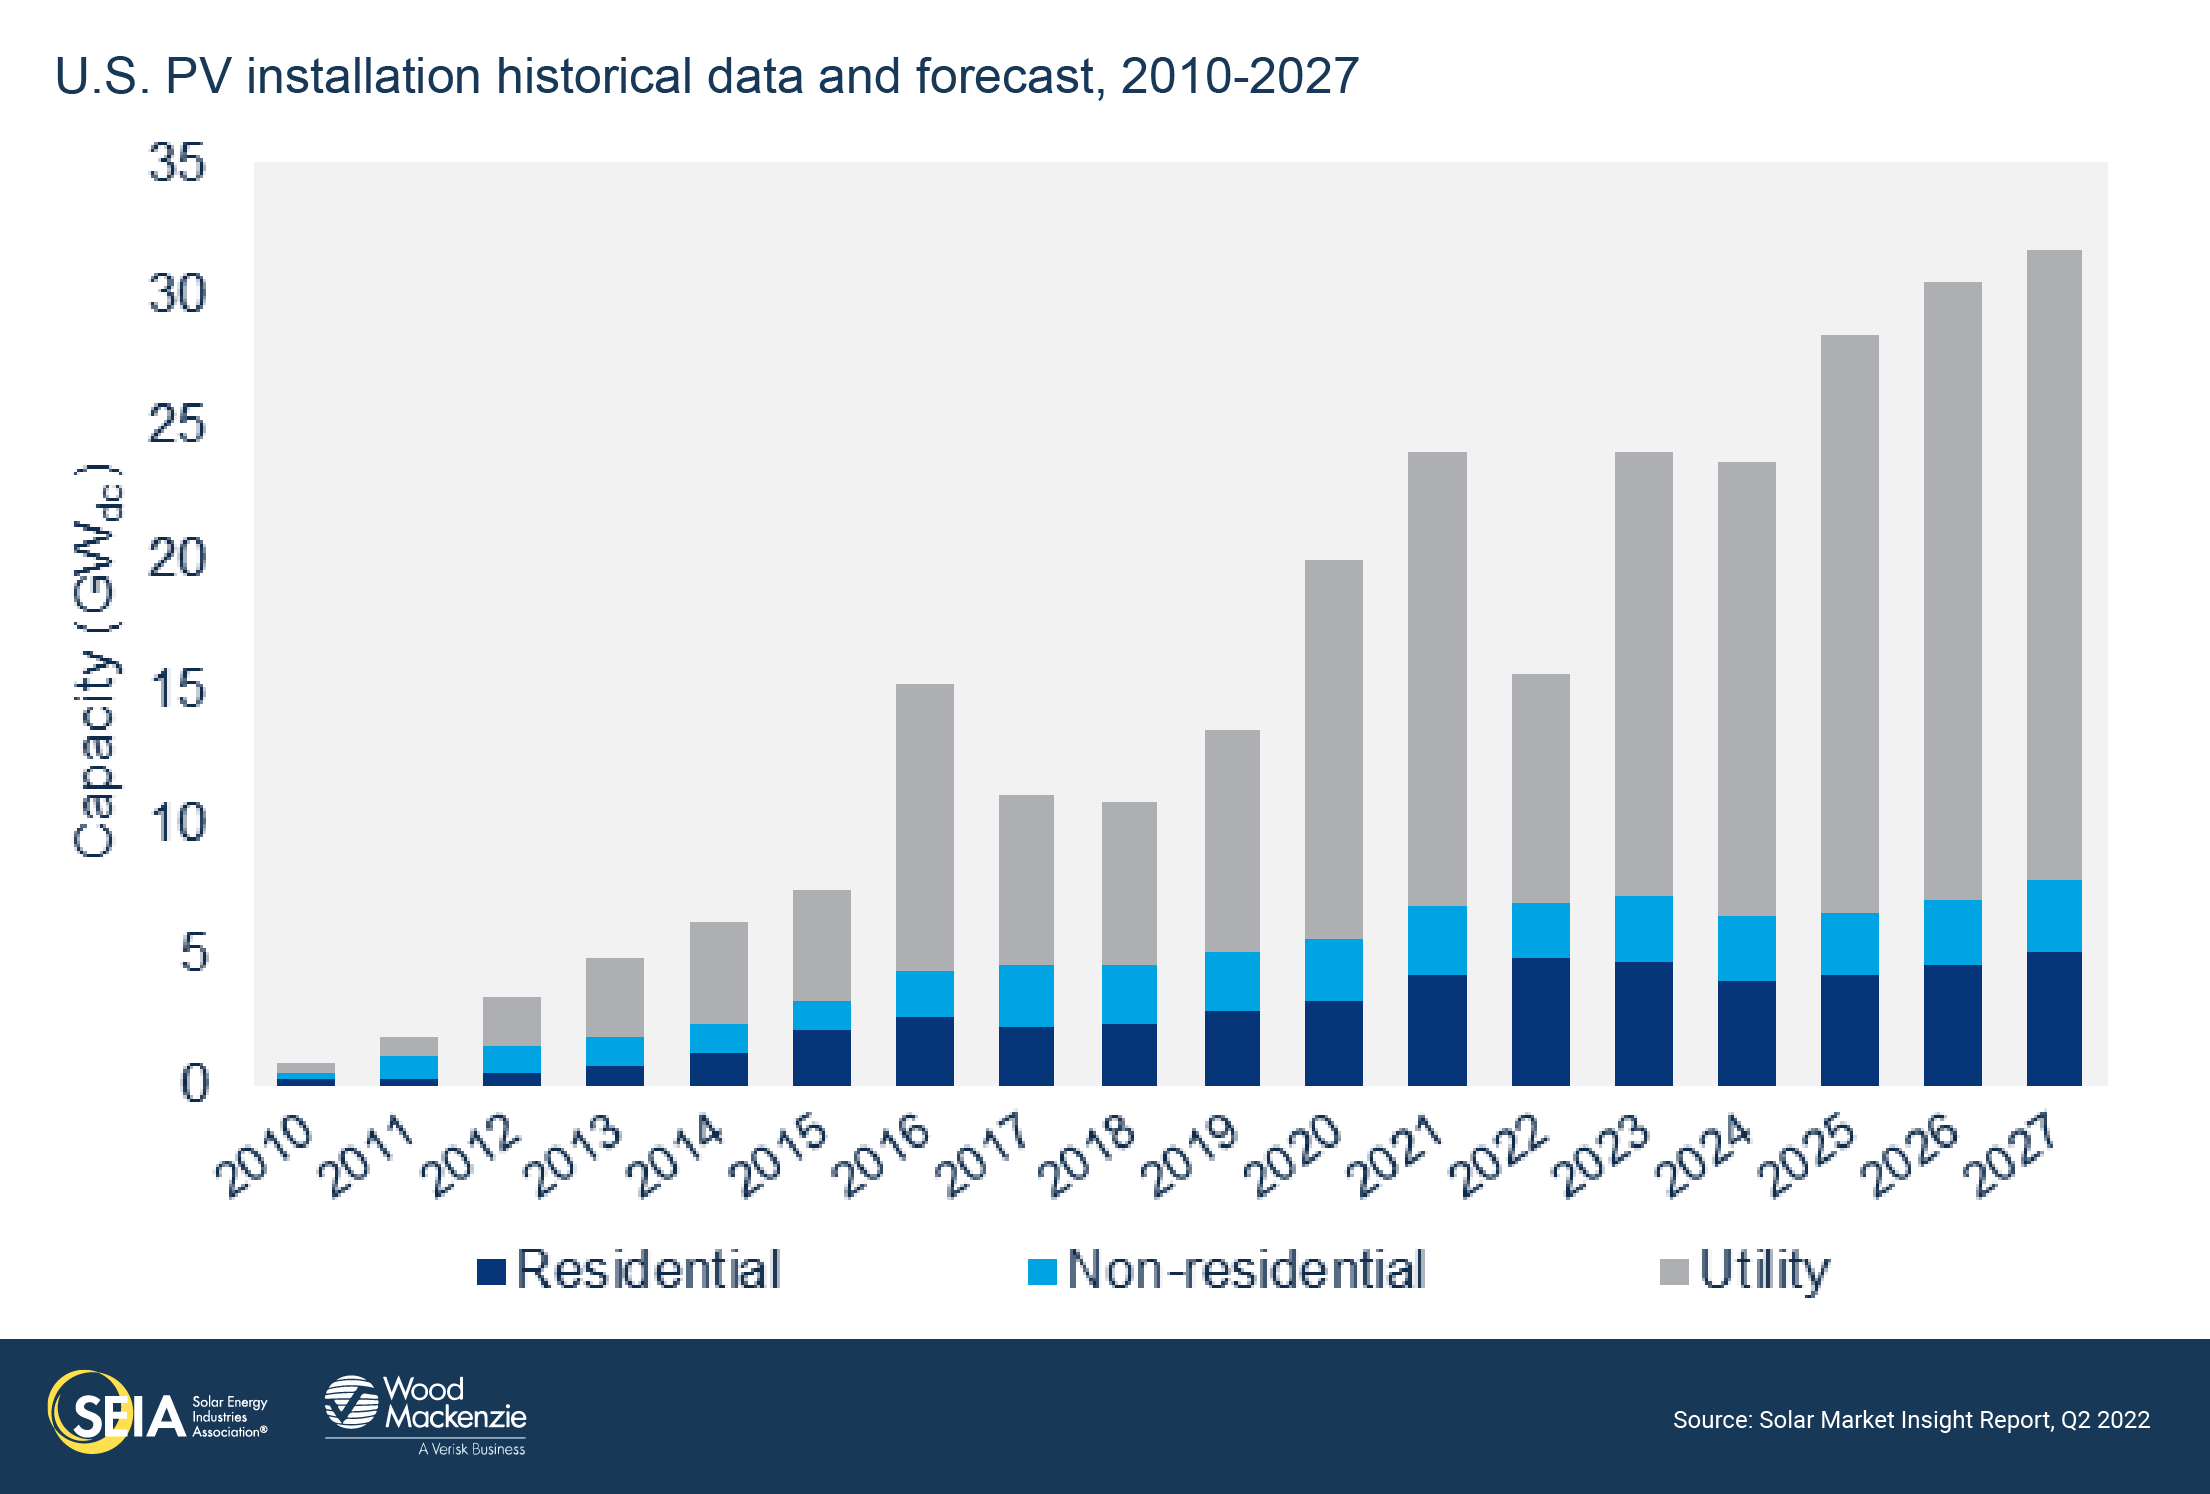
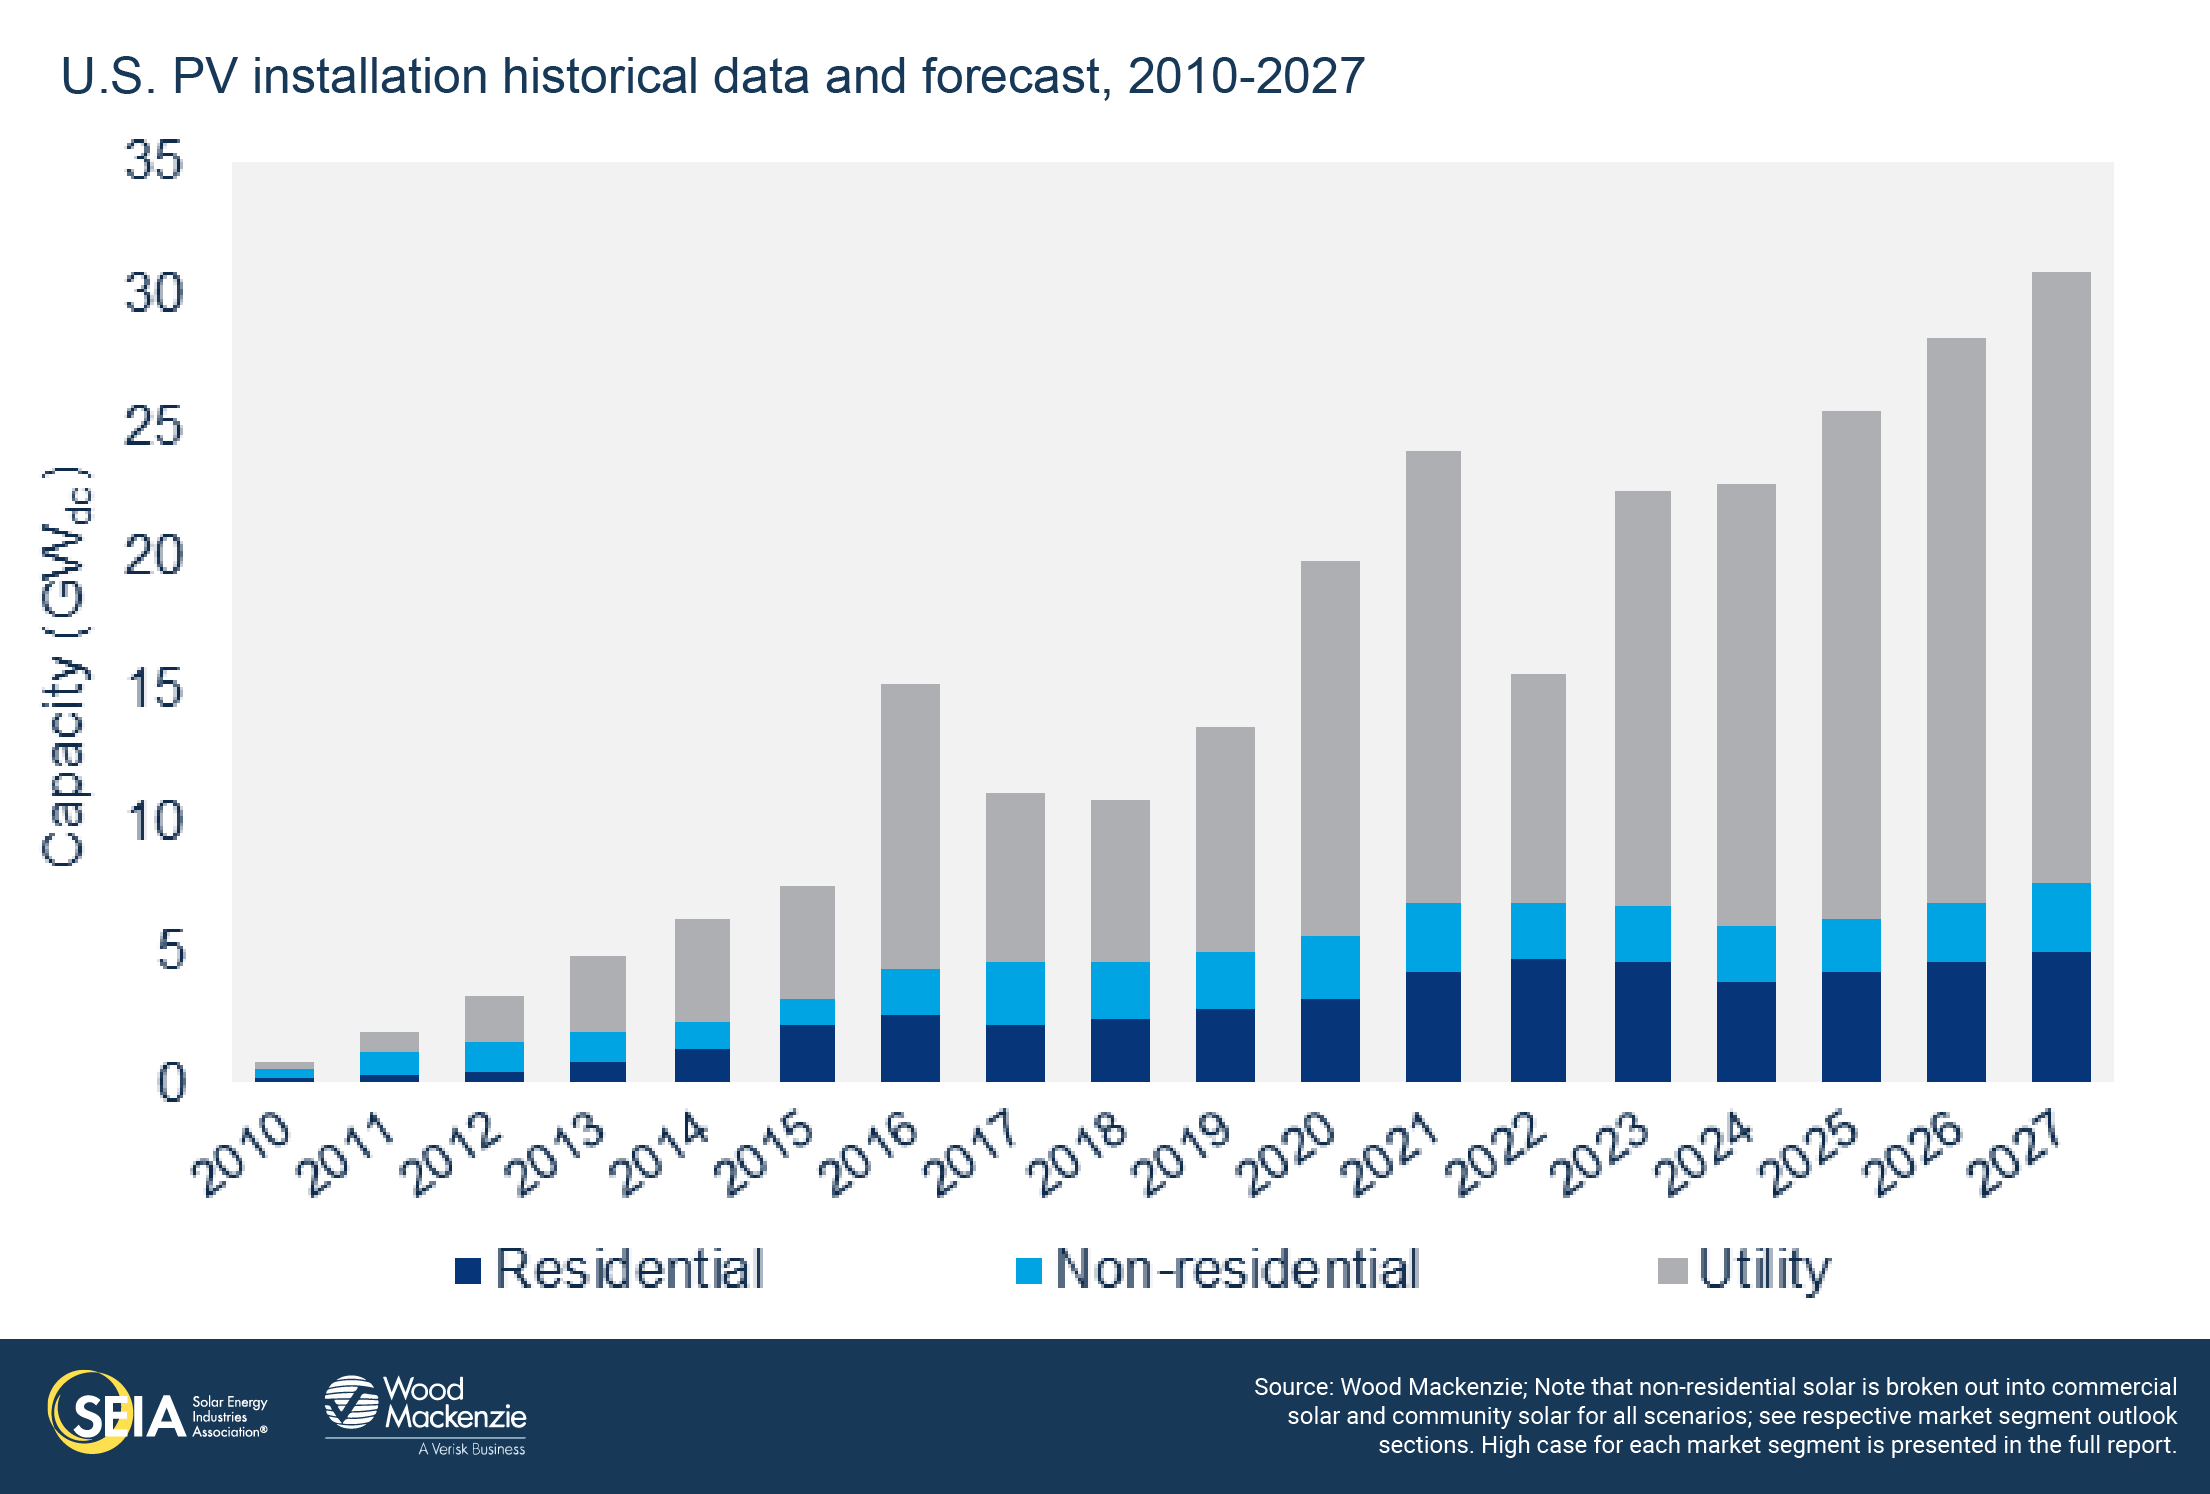
- In Q1 2022, the US solar market installed 3.9 GWdc of solar capacity, a 24% decrease from Q1 2021 and a 52% decrease from Q4 2021. This represents the weakest quarter for US solar installations in two years.
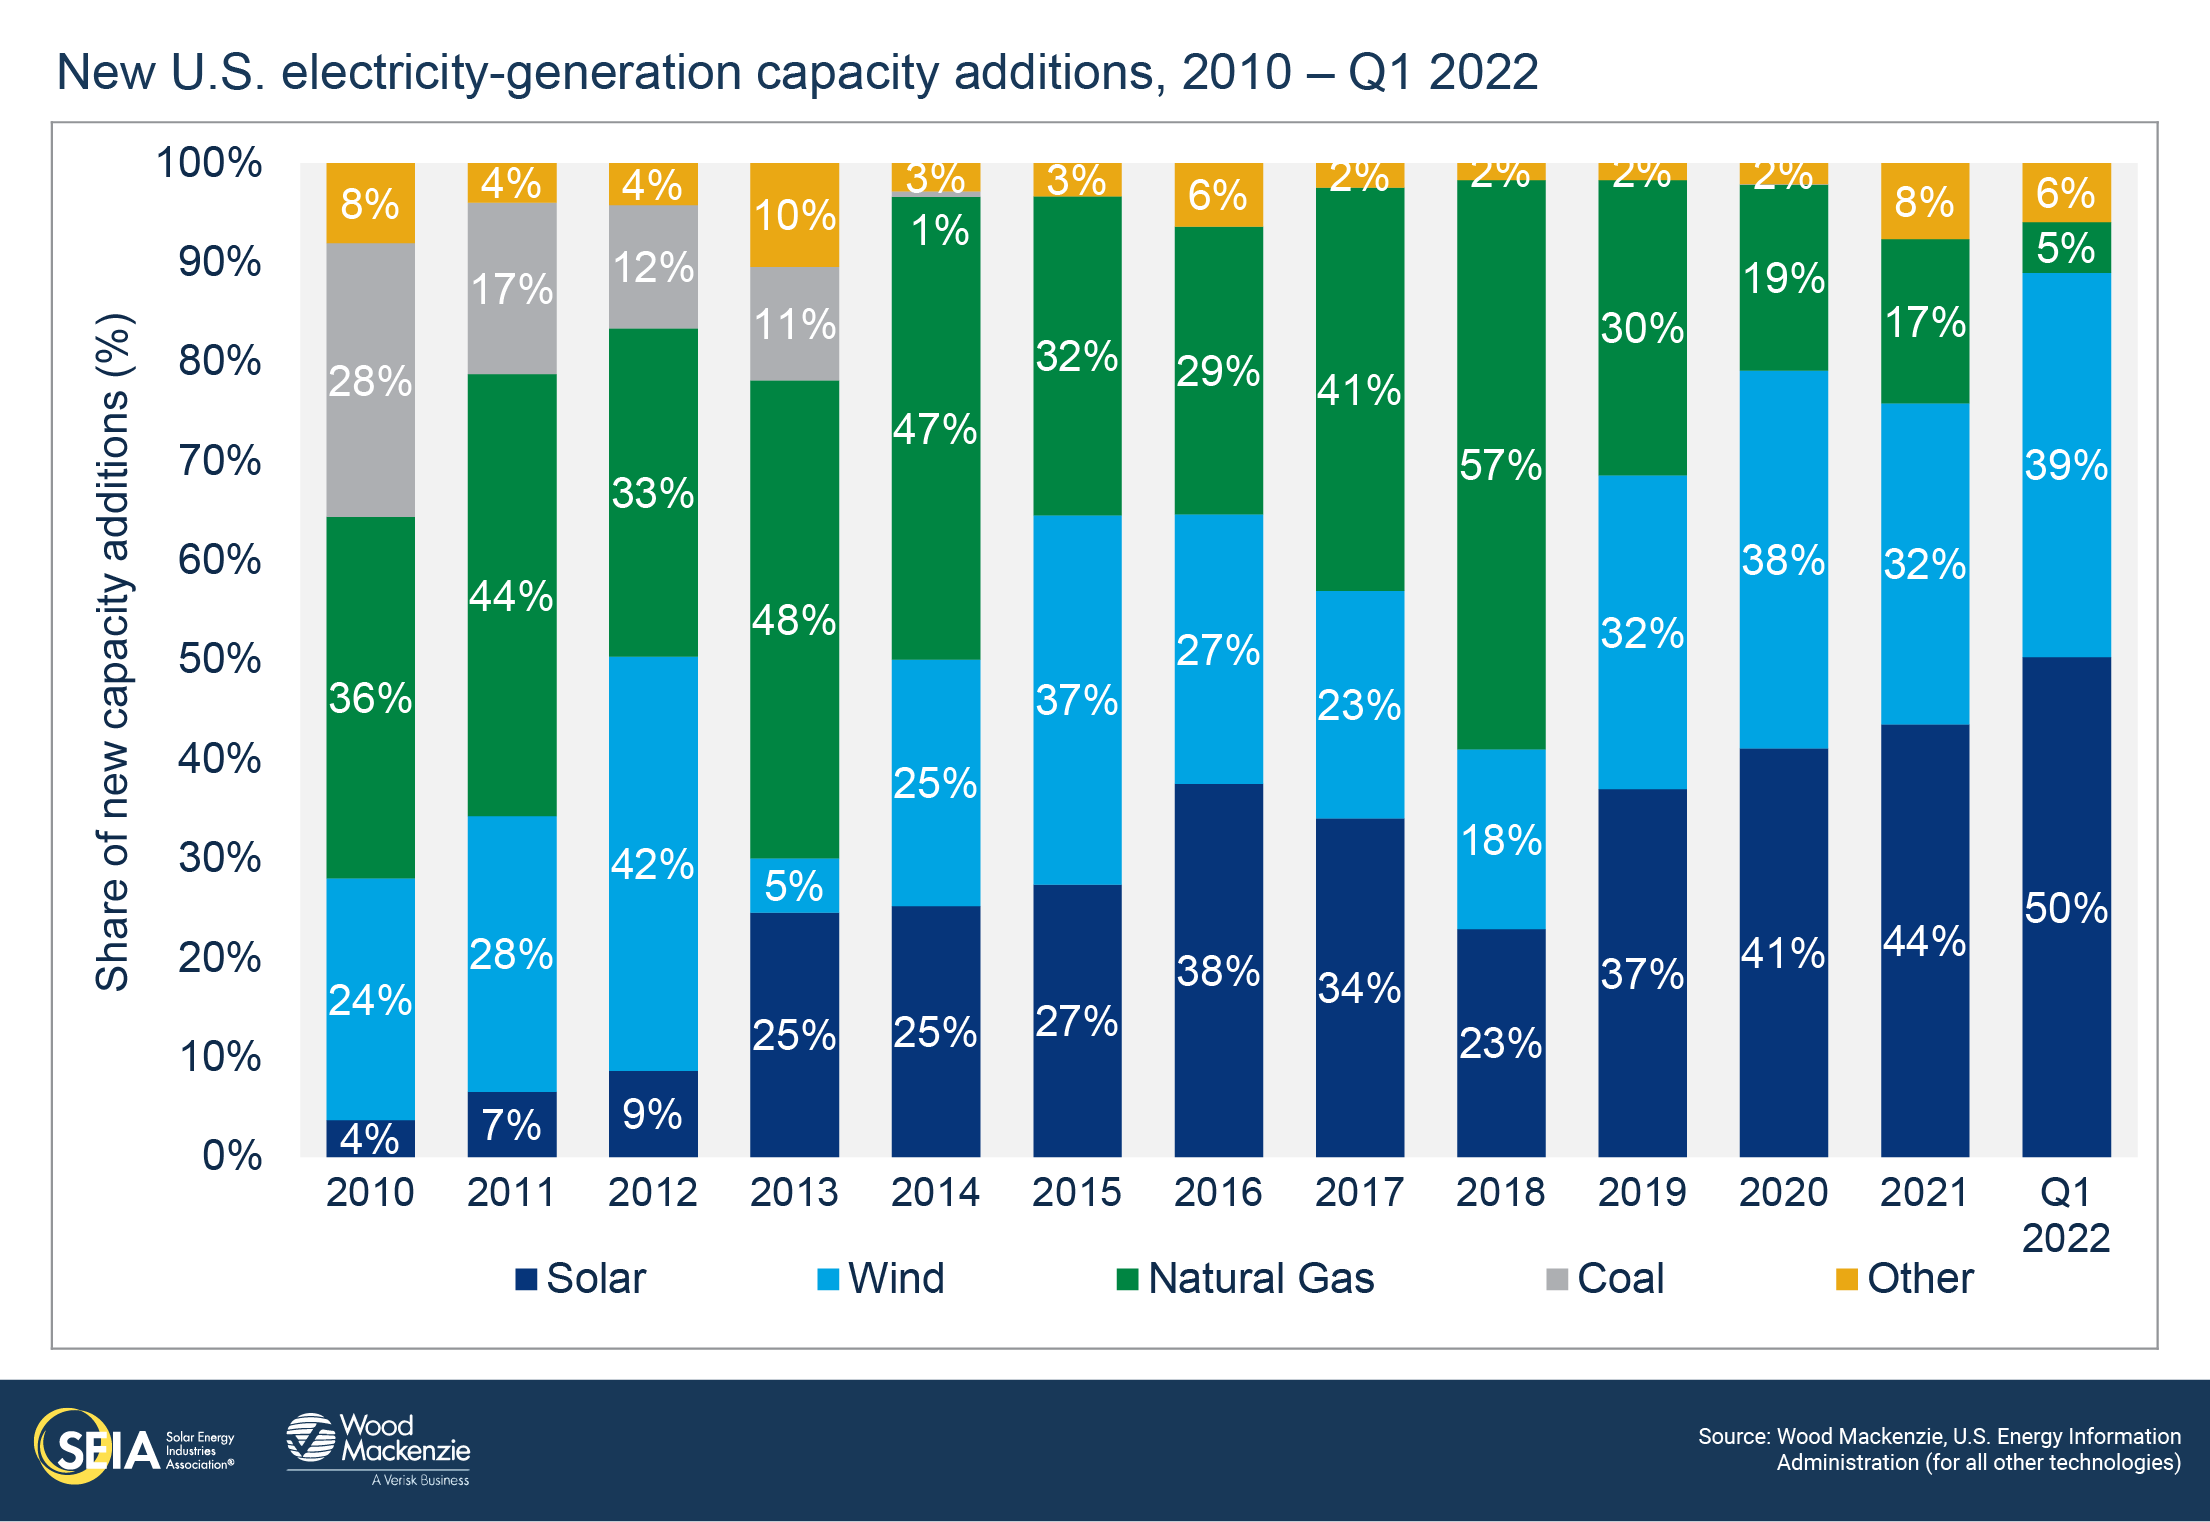
- Solar accounted for 50% of all new electricity-generating capacity added to the US grid in the first quarter of 2022.
- Residential solar had its largest quarter in history with 1.2 GWdc installed, a 30% increase over Q1 2021 and a 5% increase over Q4 2021, demonstrating the robust strength of the residential segment.
- Quarterly volumes slowed in other segments. Commercial solar installed 317 MWdc, down 11% year-over-year and down 28% quarter-over-quarter. Community solar installed 197 MWdc, up 16% year-over-year and down 59% quarter-over-quarter.
- Utility-scale solar had its lowest quarter since Q3 2019, with 2,173 MWdc installed, a 41% decrease from Q1 2021 and a 64% decrease from Q4 2021. This was primarily due to supply chain constraints and shipment delays exacerbated by trade policy disruptions in the second half of 2021. The recent announcement from the Biden administration creates 2-3 GWdc of upside to this forecast.
- The anti-circumvention investigation instigated by Auxin Solar’s petition to the Department of Commerce has wrought havoc on the solar industry. To avoid tariff risk, most manufacturers have simply stopped shipping equipment to the US, further exacerbating the supply chain constraints of the last year.
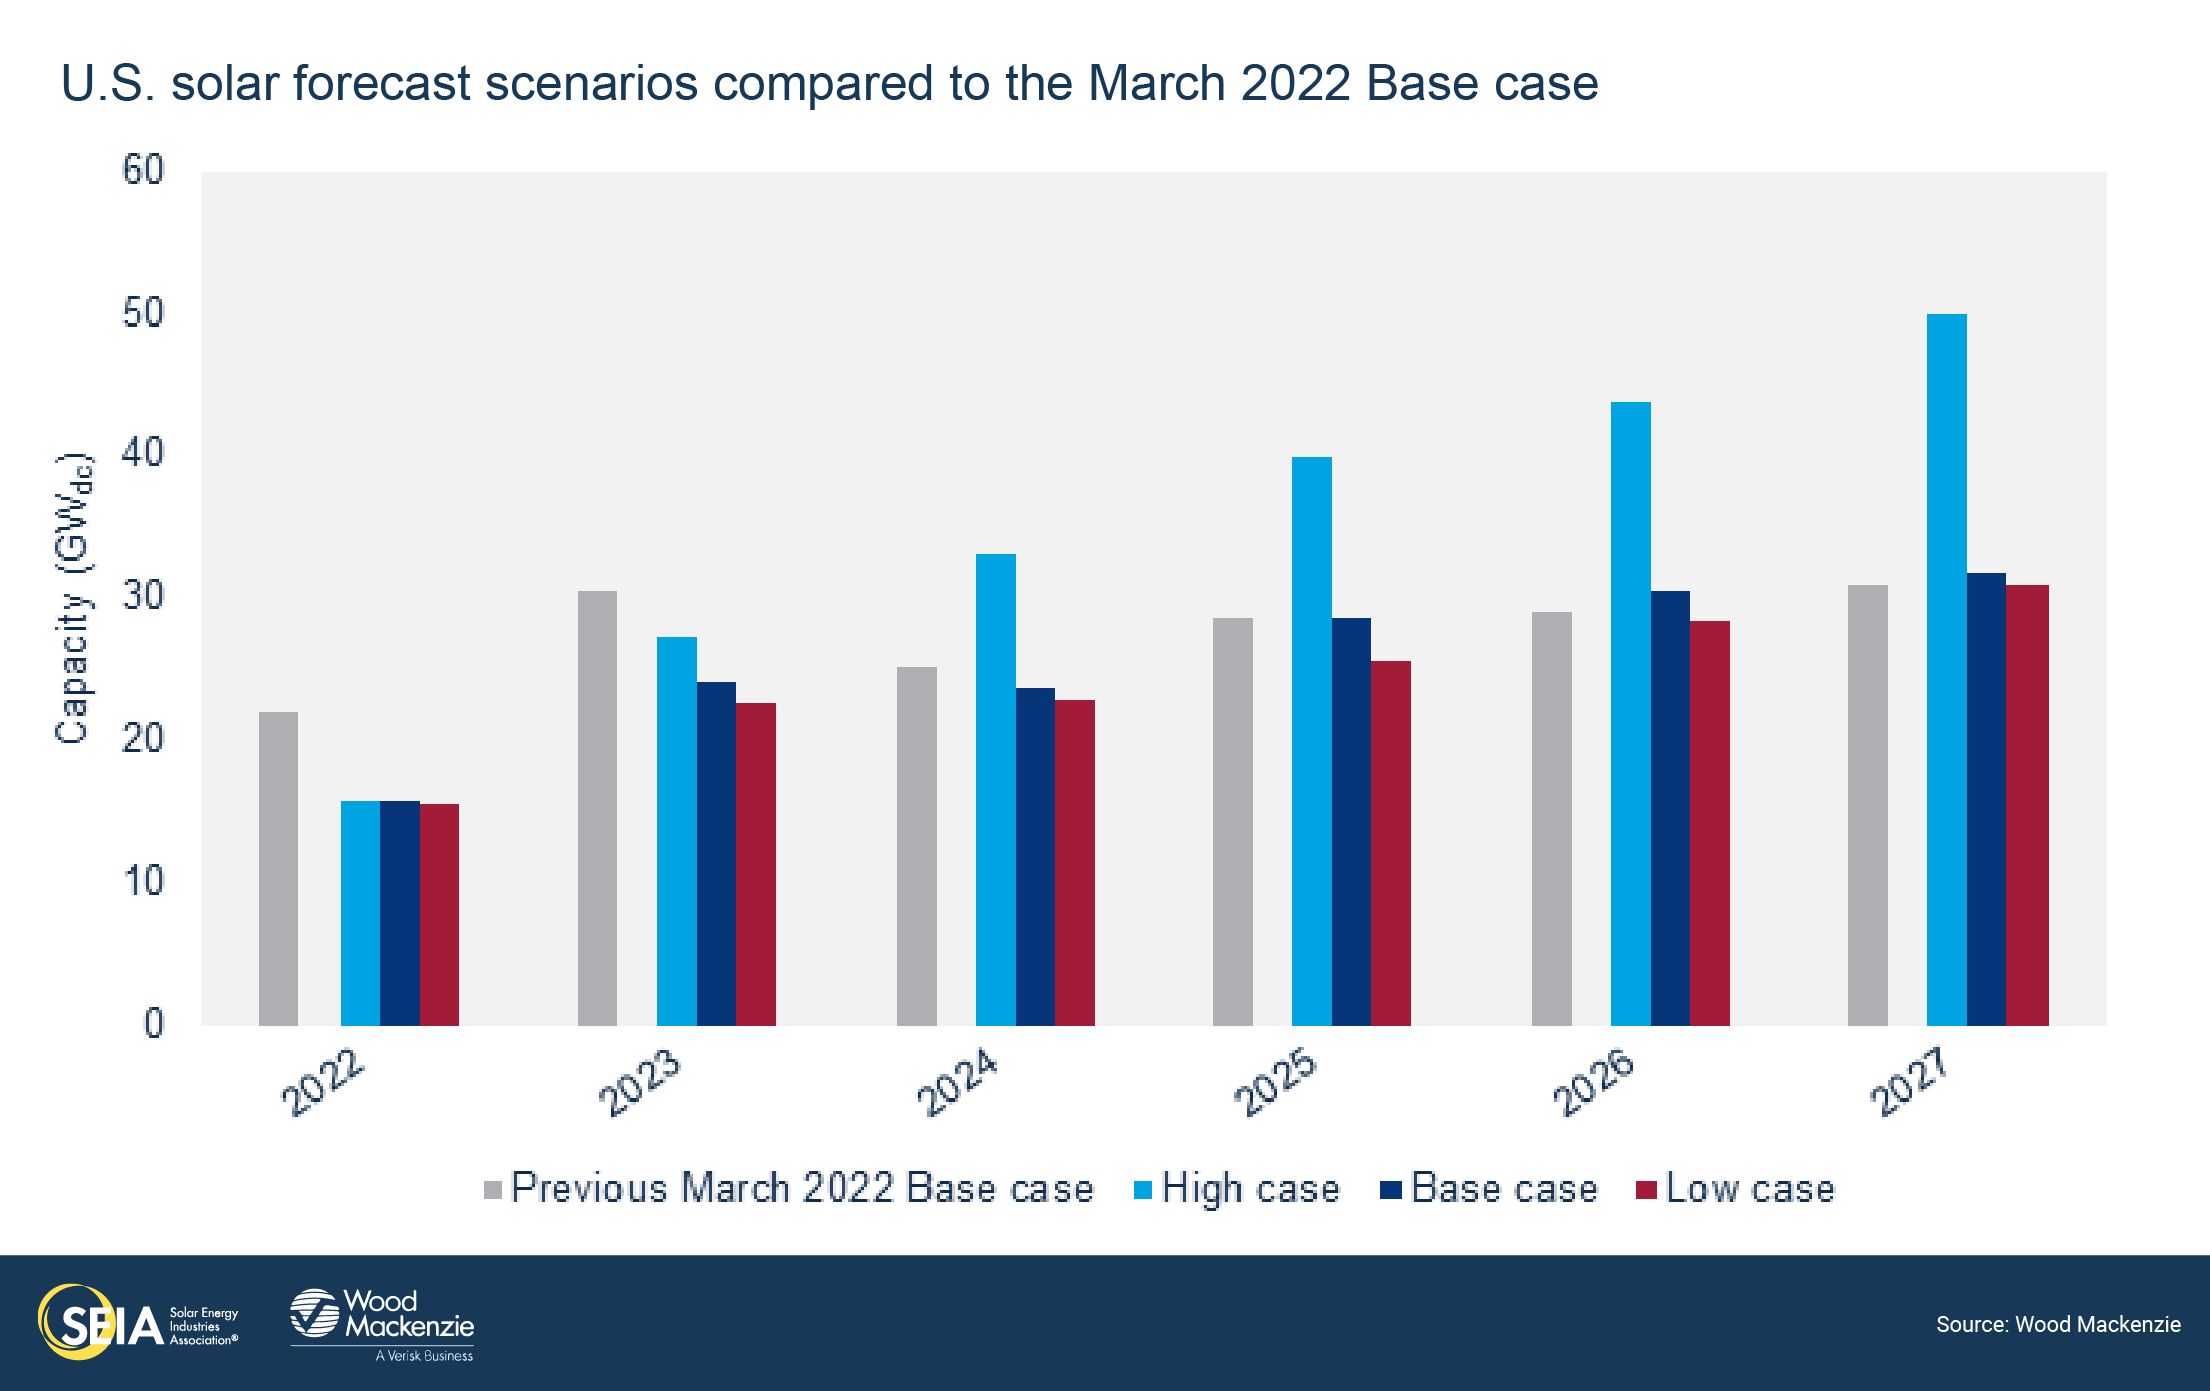
- The uncertainty created by the anti-circumvention investigation has reduced expectations for 2022 solar installations to 15.6 GWdc, a 6.3 GWdc reduction (29%) from our 2022 outlook from last quarter, which had already been reduced due to supply chain constraints. Over the last nine months, 2022 forecasts have been cut in half.
- The utility-scale solar pipeline also took a massive hit. According to Wood Mackenzie’s pipeline data, 17.6 GWdc of projects in development were delayed by at least a year and 450 MW of projects were canceled outright. New procurement for utility-scale solar was 2.4 GWdc in Q1 2022, its lowest level since 2017, and much lower than the 2021 quarterly average of 6.7 GWdc.
2. Introduction
The US solar industry installed 3.9 gigawatts-direct current (GWdc) of capacity in the first quarter of 2022, a 24% decrease from Q1 2021 and a 52% decrease from Q4 2021.
First-quarter volumes came with mixed results across segments. Residential solar had its highest quarter yet as customer demand and sales pipelines continue to grow. However, commercial solar shrank 28% quarter-over-quarter and community solar shrank 59% quarter-over-quarter. Utility-scale solar had its lowest quarter in more than two years, with 2.2 GWdc installed, a 41% contraction from Q1 2021 and a 64% contraction from Q4 2021. This was caused by a combination of typical first quarter slowdowns, policy-driven supply chain challenges, and higher equipment pricing.
Overall, solar PV accounted for 50% of all new electricity-generating capacity additions in the first quarter of 2022.
Anti-circumvention investigation throws the solar industry into chaos
On March 28th, 2022, the Department of Commerce (DOC) announced it would initiate an anti-circumvention investigation of Chinese anti-dumping and countervailing duties (AD/CVD) for solar cells and modules imported from Cambodia, Malaysia, Thailand, and Vietnam. This investigation (referred to throughout as the anti-circumvention investigation) was initiated by a petition submitted in February 2022 by California-based module manufacturer Auxin Solar. The petition alleges that solar cell and module manufacturers are circumventing existing AD/CVD tariffs that apply to Chinese imports by manufacturing solar cells and modules in the four named countries using raw inputs from China.
The existing AD/CVD tariffs that apply to Chinese solar equipment vary widely depending on the manufacturer. These have ranged from the low teens to above 100% for major manufacturers that met the following criteria: 1) existed during the original 2012 investigation, 2) manufactured crystalline silicon cells at that time, and 3) cooperated with the original investigation. If any of these three conditions is not met, a company would be subject to the countrywide rate of approximately 250%. For example, a company that only makes wafers would not have a company-specific rate.
The deadline for a preliminary determination from the DOC is August 29th, 2022, with opportunities to comment on the preliminary determination in the subsequent months. The final determination deadline is January 26th, 2023, with the potential for that deadline to be extended to April 3rd, 2023.
For obvious reasons, the anti-circumvention investigation has caused immense uncertainty across the industry. Roughly 80% of all solar module supply to the US comes from these four countries. And much of the domestic module industry relies on solar cells from these same countries. Since late March/early April, most manufacturers have halted shipments to the US, given the unknown tariff risk. Southeast Asian factories have idled operations, ensuring much of the damage to this year already. Projects without equipment in the US face months of delays and unknown pricing impacts. Many in the solar industry have resigned themselves to several months of minimal to no development activity.
This investigation arrived as the solar industry was already struggling with equipment availability and elevated pricing. Consequently, our 2022 base case expectations have been reduced to 15.6 GWdc, a 6.3 GWdc reduction (29%) from our previous 2022 Base case outlook. Most of this reduction comes from the utility-scale solar segment, which has decreased by more than 40% compared to our previous outlook. These downward revisions are buffered slightly by the fact that some product had already been shipped into the country before the investigation was initiated.
Introducing three new forecast scenarios
In addition to the uncertainty of the anti-circumvention investigation, the industry is still waiting on the potential passage of clean energy policies in a federal reconciliation bill (originally included in the Build Back Better Act). The most important incentives in this package include an extension and expansion of the Investment Tax Credit (ITC) and Production Tax Credit (PTC), a new standalone storage ITC, tax credits for solar manufacturing, and direct payment options for tax credits. Given this combination of multiple near-term policy uncertainties, Wood Mackenzie is presenting three different forecast scenarios in this report, as defined below.
- Low case = Affirmative preliminary ruling in the anti-circumvention investigation (tariffs are imposed on the four named countries), with no passage of federal clean energy incentives package
- Base case = Negative preliminary ruling in the anti-circumvention investigation (tariffs are not imposed on the four named countries), with no passage of federal clean energy incentives package
- High case = Negative preliminary ruling in the anti-circumvention investigation (tariffs are not imposed on the four named countries), with passage of federal clean energy incentives package
All three of these scenarios account for the near-term impacts that the anti-circumvention investigation has already levied on the industry. Regardless of the preliminary and final determinations in this case, the damage to project timelines has already been done, as demonstrated by the decrease to our Base case outlook. In each scenario, we assume the industry moves forward after the preliminary rulings in late August, given the low likelihood of such a ruling being reversed in early 2023.
AD/CVD tariffs would reduce demand, but the near-term uncertainty of the investigation is the most damaging
For the Low case, Wood Mackenzie assumed an average AD/CVD tariff level of 41% (15% for countervailing duties and 26% for anti-dumping duties). If tariffs are imposed, the final tariff levels will vary between manufacturers. But this broad average assumes, importantly, that new AD/CVD tariffs will be similar to those currently imposed on Chinese imports. This would increase today’s blended average module prices by 30-34% depending on the module technology and market segment.
Overall, new AD/CVD tariffs would reduce solar installations from 2022-by 8.5 GWdc, compared to the Base case. But this is on top of the nearly 12 GWdc reduction already factored into our base case from the initiation of the investigation alone. This brings the total potential damage of the anticircumvention investigation to 20.3 GWdc of demand destruction, in addition to increased costs and gigawatts of project delays.
Utility-scale solar accounts for most of the expected demand destruction from the tariffs this year (6.9 of the 8.5 GWdc). Higher module prices would certainly make some projects unviable - the capex for utility-scale solar would increase by 10-15%. But some projects are moving forward despite price increases as a loss minimization strategy. In some cases, utility offtakers are depending on solar projects for resource adequacy and will pass on the higher costs to ratepayers. In other cases, projects have accrued significant sunk costs, so developers are moving forward as a calculated risk. In these instances, developers are choosing potential project default with a positive determination over certain project default due to delays while waiting for a negative determination.
Distributed solar remains more insulated from increasing module prices because equipment makes up a smaller portion of total project costs. However, larger, well-capitalized distributed solar companies are better positioned to adapt to price increases than smaller, local companies. The forecast for non-utility solar is still down 2% compared to last quarter’s Base case outlook.
The most damaging element of the anti-circumvention investigation is the months of near-term uncertainty that it is causing this year. Elevated pricing from new tariffs would certainly compound the impacts of price inflation on other parts of the supply chain — but this is not the biggest source of near-term pain. The investigation represents nearly unbounded risk given the uncertainty of tariff levels and their retroactive applicability. Time and time again, uncertainty has proven to be the strongest solar market suppressant.
As the Department of Commerce deliberates this investigation, uncertainty for the solar industry grows, and ultimately, so does the level of near-term demand destruction. However, an expedited negative preliminary determination could reduce losses heading into next year, representing upside potential for our Base case forecast.
3. Market segment outlooks
3.1. Residential PV
Key figures
- 1,247 MWdc installed in Q1 2022
- Up 30% from Q1 2021
- Up 5% from Q4 2021
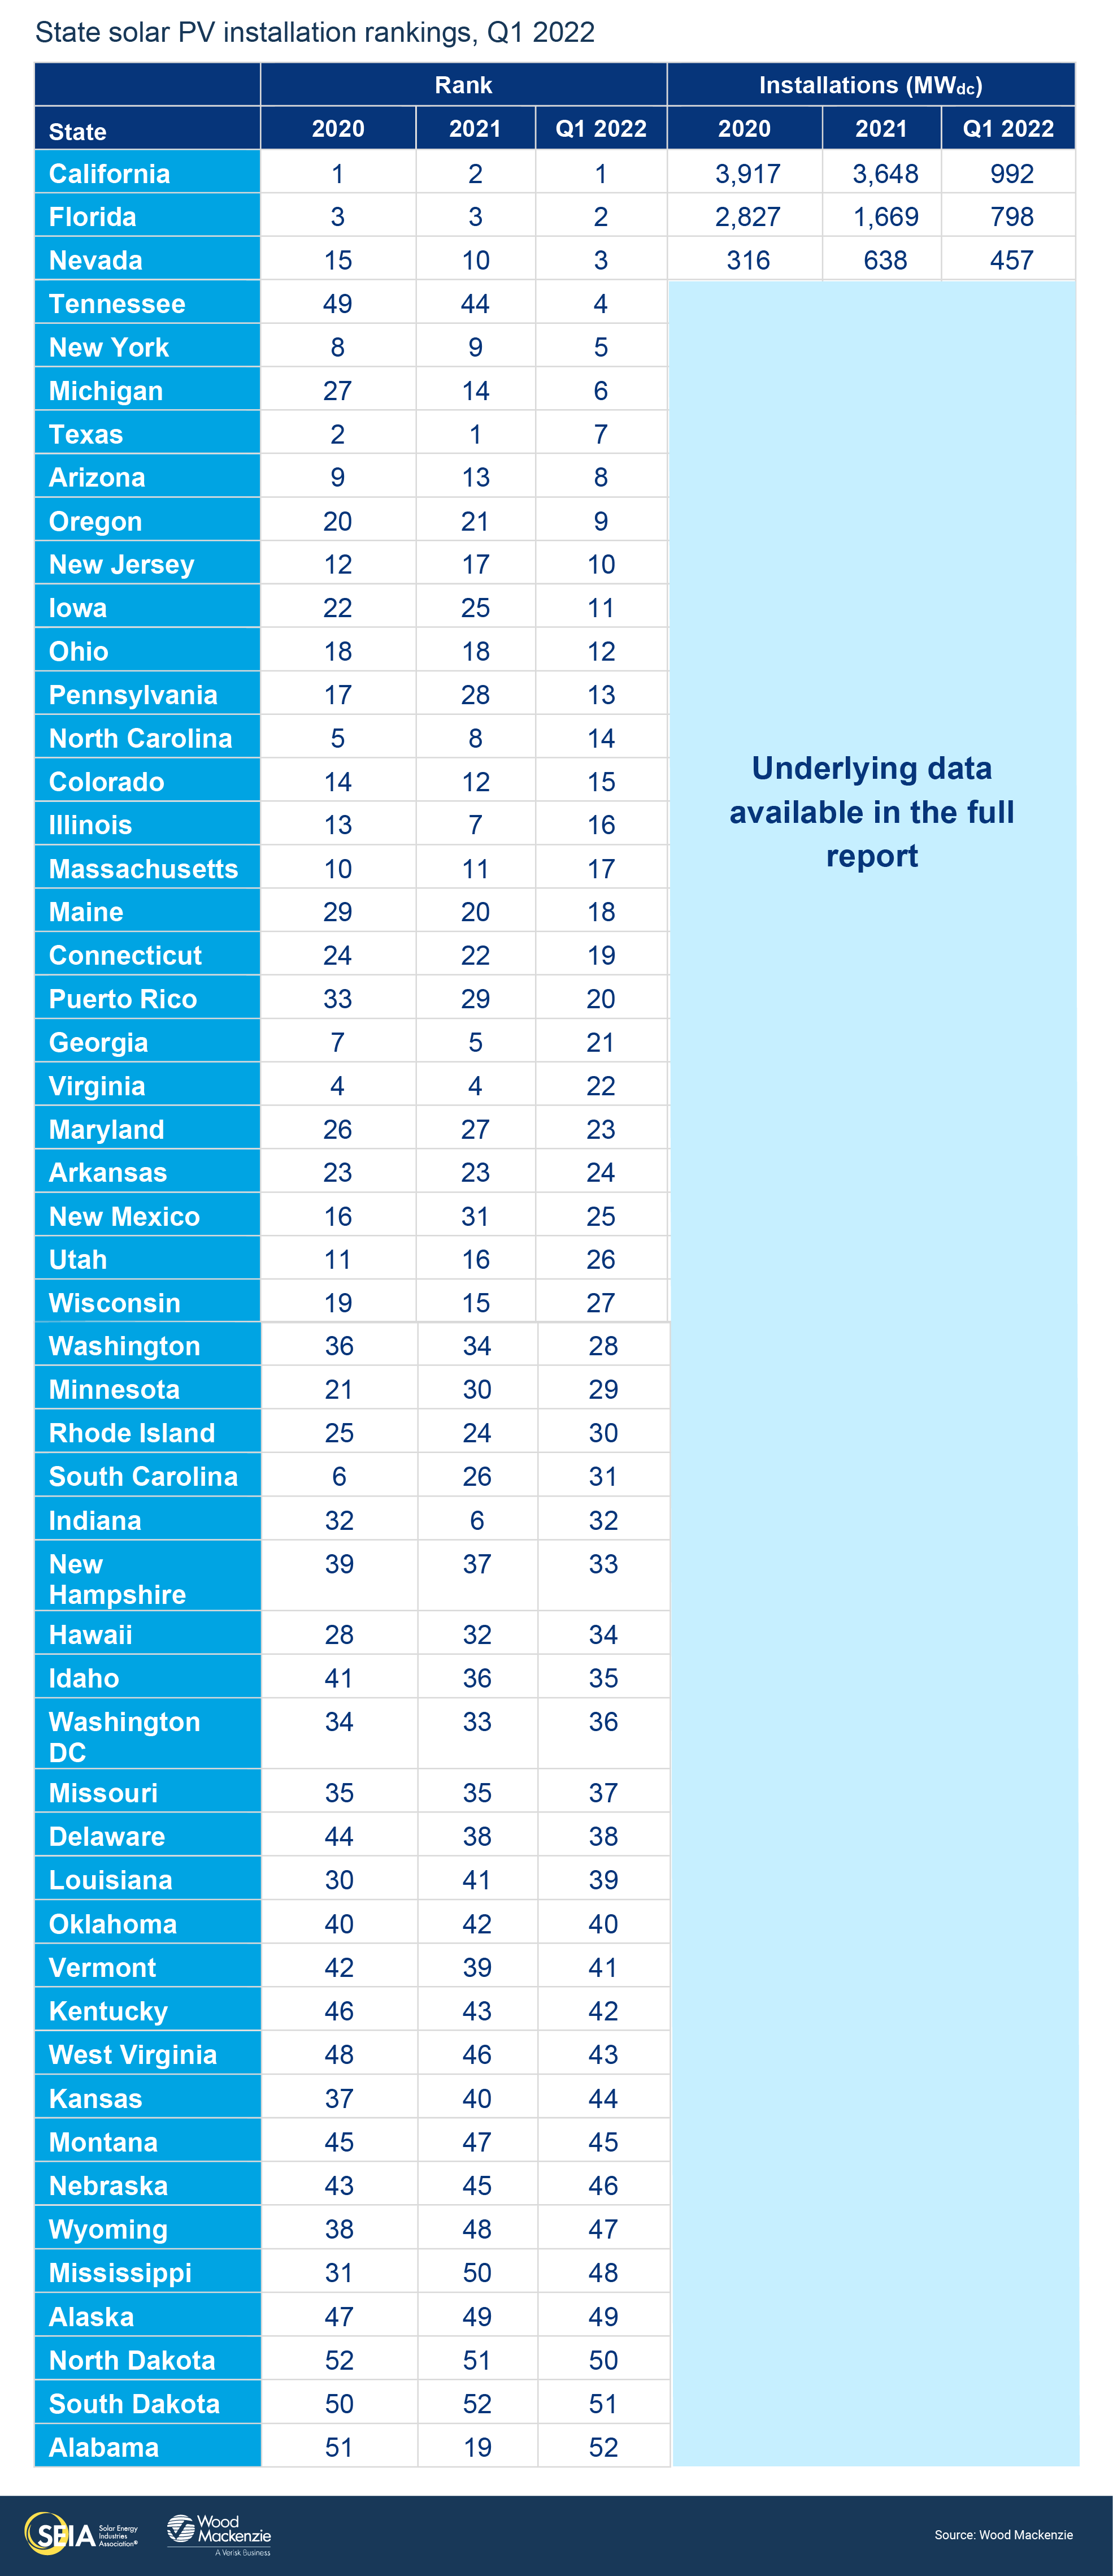
The residential solar market added a record 1,247 MWdc of newly installed capacity in Q1 2022. Consumer demand continues to grow in most state markets, with California, Florida, and Texas leading the way in Q1. These top markets also achieved record capacity deployments and accounted for more than 50% of nationwide residential solar installed in Q1. Installers worked through project backlogs and converted record sales volumes into completed installations in Q1. Many players report that rising electric utility rates are catalyzing strong demand and outweighing inflation and system price increases.
Despite the industry’s recent successes, the anti-circumvention investigation provides significant near-term challenges. Any company that is involved in procurement has turned its prime focus toward acquiring modules.
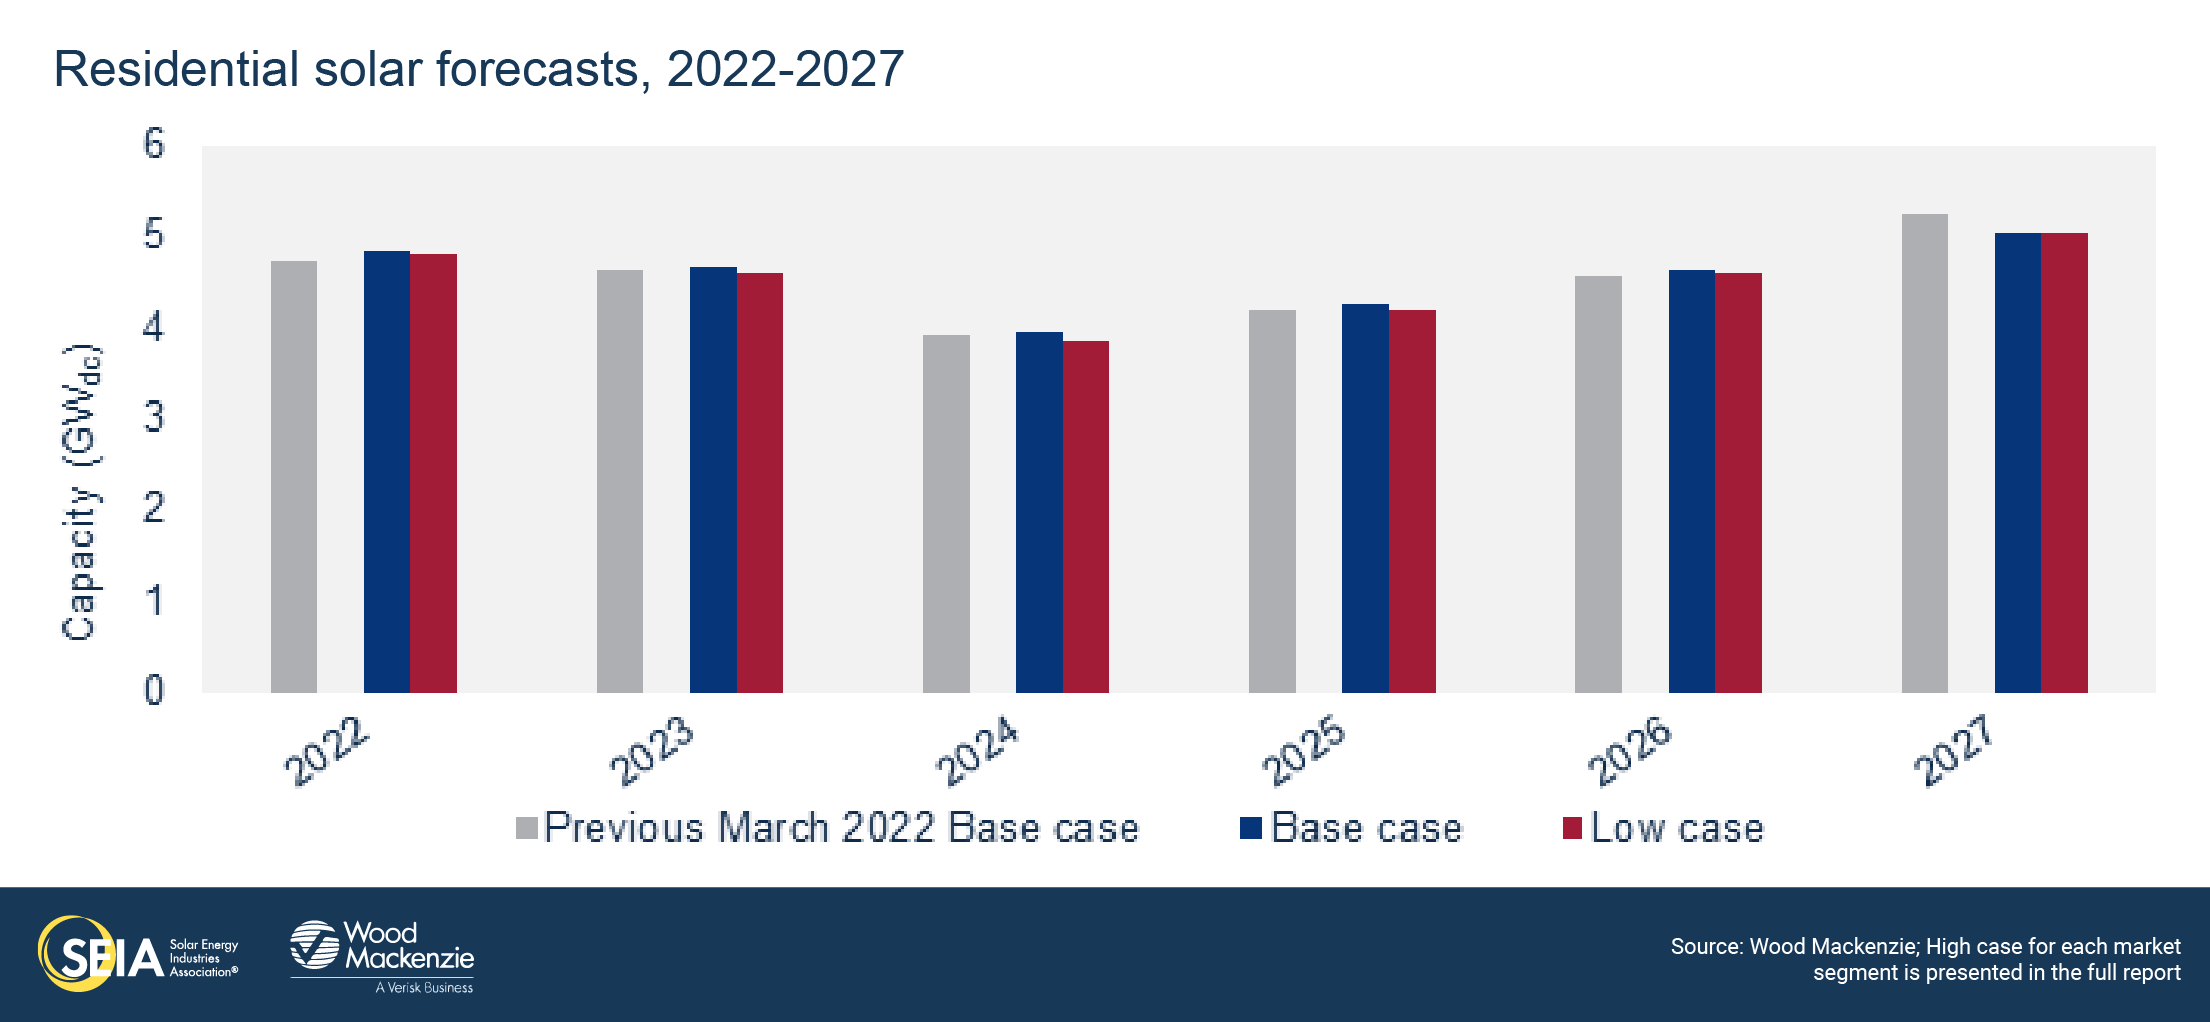
Overall, Wood Mackenzie has increased residential solar expectations for 2022. The delay of the NEM 3.0 proceeding will allow the California market to enjoy a full year of deployments under current, more favorable rates. These upward revisions in California more than offset nationwide downward revisions due to the anti-circumvention investigation. As a result, we forecast 14% year-over-year growth in 2022 in our Base case nationally. The Low case shows small reductions from our Base case, because modules account for a smaller share of the residential solar cost stack. Granted, impacts will be felt differently across the segment based on an installer’s ability to secure module supply at favorable prices. The High case would add 6.3 GWdc (23%) of additional deployment for 2022-2027, compared to the Base case.
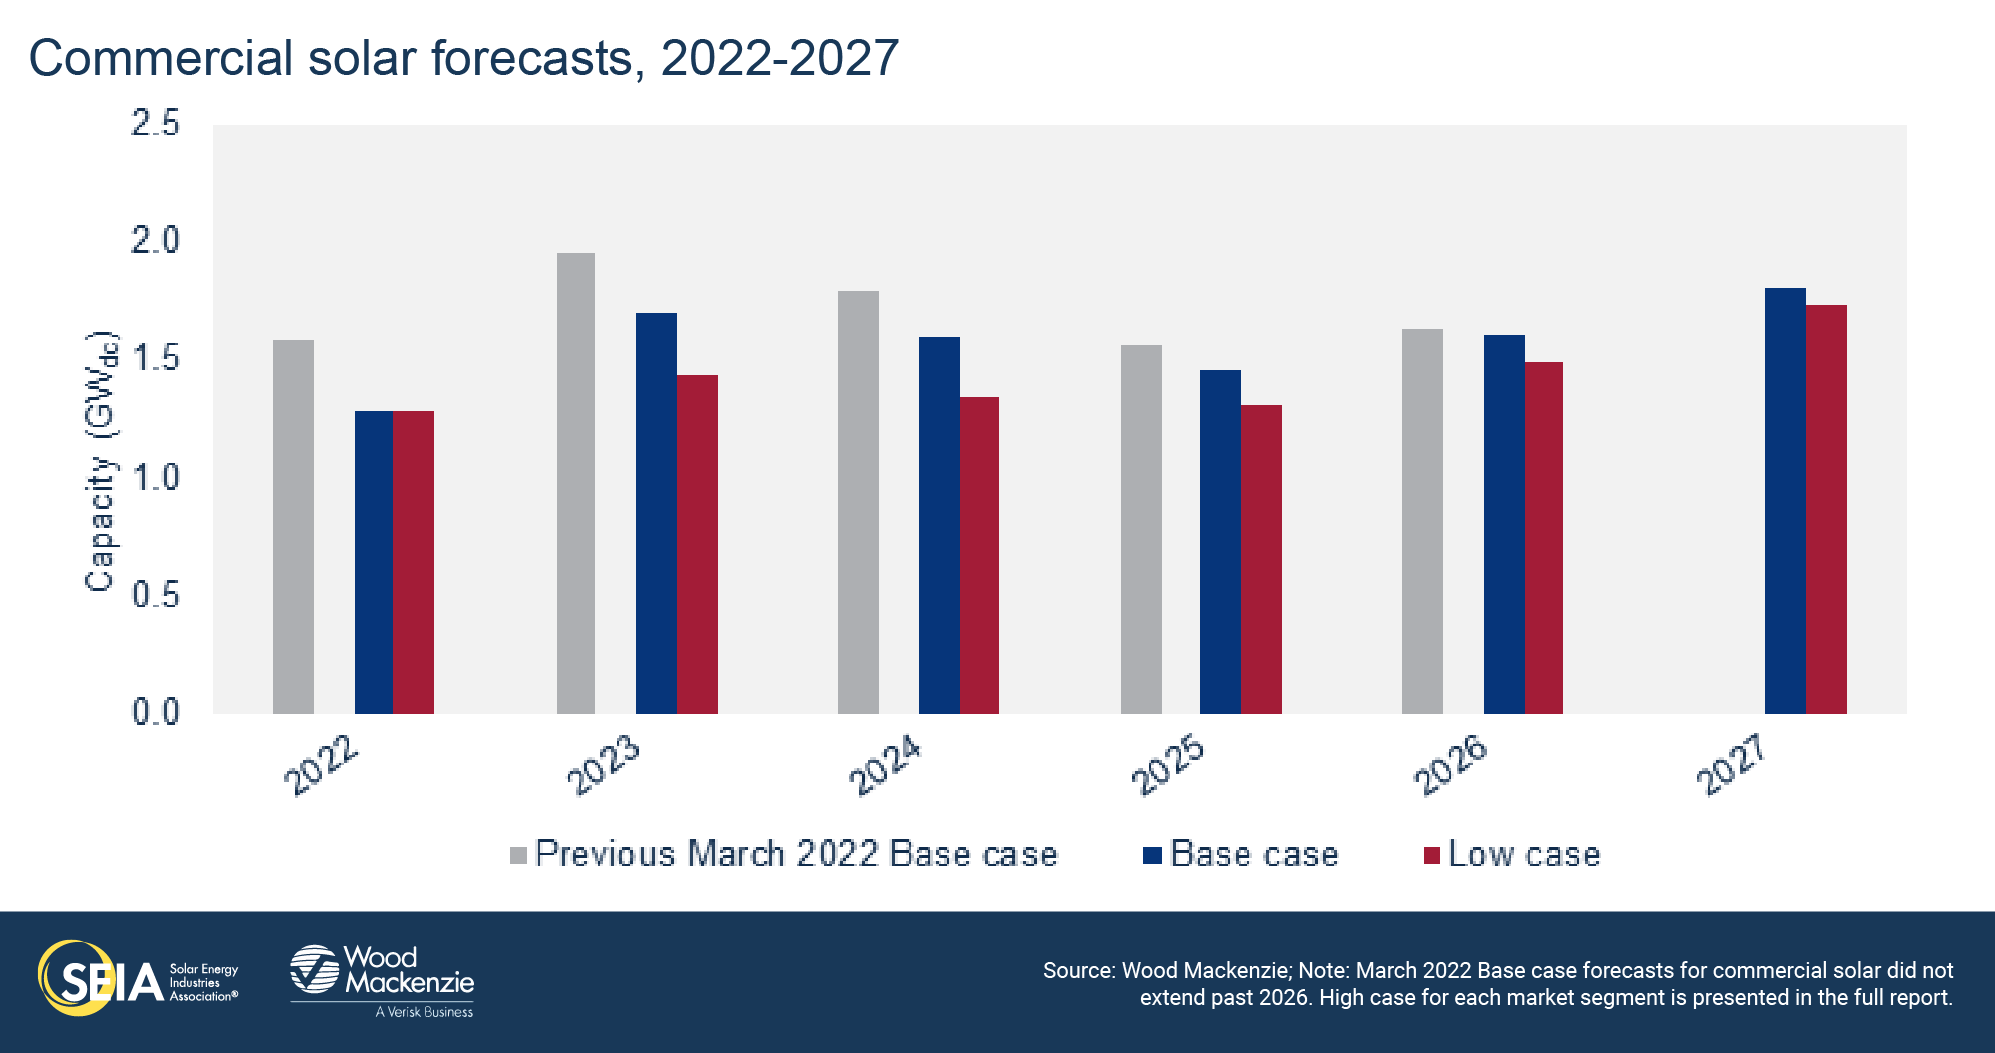
3.2. Commercial PV
Key figures
- 317 MWdc installed in Q1 2022
- Down 11% from Q1 2021, down 28% from Q4 2021
Note on market segmentation: Commercial solar encompasses distributed solar projects with commercial, industrial, agricultural, school, government or nonprofit offtakers, including remotely net-metered projects. This excludes community solar (covered in the following section).
Commercial solar volumes shrank quarter-over-quarter and year-over-year in Q1 2022, impacted by continuing supply chain constraints and project delays. While projects spilled over from 2021 to 2022, the first quarter of the year is typically less active for project construction, given that many major markets were in the middle of winter.
Prior to the initiation of the anti-circumvention investigation, Wood Mackenzie expected modest growth in commercial solar in 2022 (6%). We are now expecting a 14% decline this year compared to 2021. Developers differ in their inventory levels and access to supply. Some developers have secured equipment for the next year of projects, but many report that they don’t have equipment for a decent portion (20-30%) of their planned 2022 pipeline. This drives the 14% decline expected this year in the Base case, while increasing growth in 2023 to 32%.
If AD/CVD tariffs are imposed at assumed levels, it would increase today’s commercial solar pricing by 13-17% depending on the state. While many projects are expected to adapt to higher costs through a combination of increased pricing for end customers and margin compression, other projects won’t be viable. As a result, commercial solar volumes are expected to decrease by 10%, or almost a gigawatt, from 2022-2027. By contrast, commercial solar increases by almost 20%, or 1.8 GWdc in the High case.
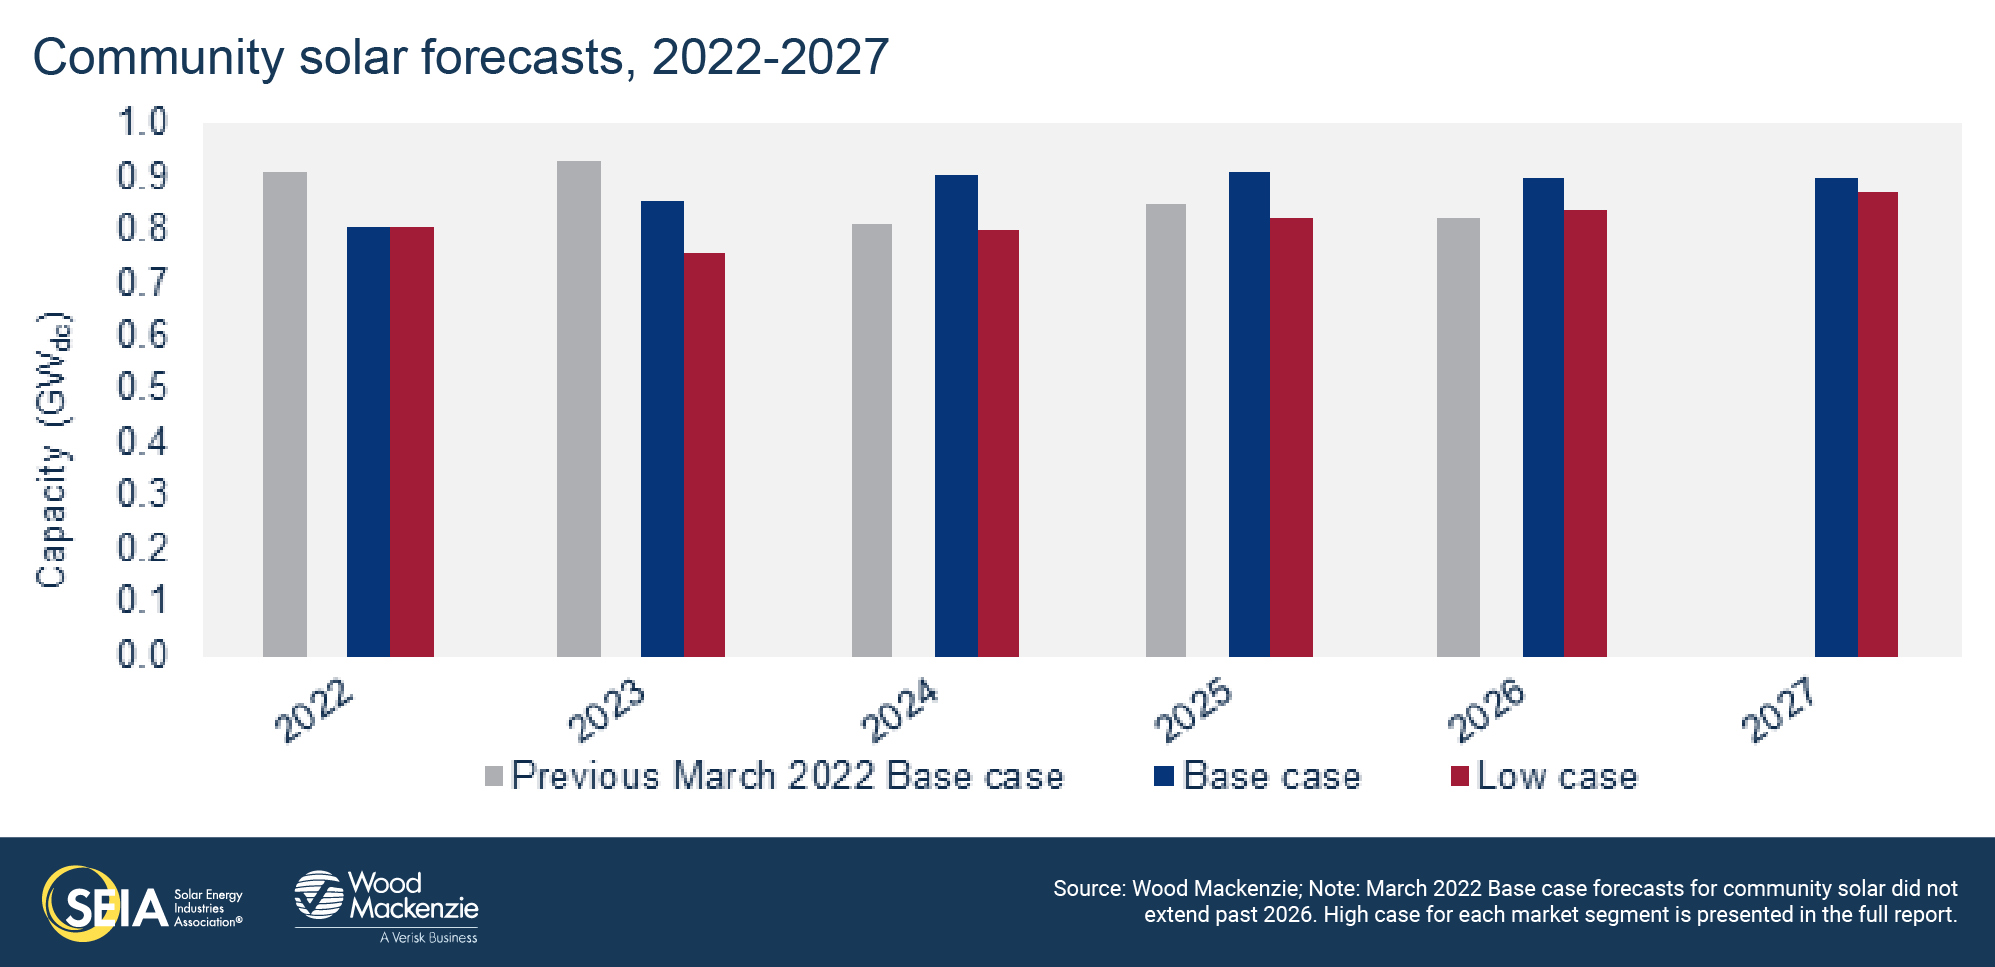
3.3. Community solar PV
Key figures
- 197 MWdc installed in Q1 2022
- Up 16% from Q1 2021
- Down 59% from Q4 2021
Note on market segmentation: Community solar projects are part of formal programs where multiple customers can subscribe to the power produced by a local solar project and receive credits on their utility bills.
Community solar installations in Q1 2022 were significantly lower quarter-over-quarter, due to the typical drop in first quarter installations, but were up 16% year-over-year. After a record-setting 2021, community solar installations in 2022 are expected to contract due to uncertainty around the anti-circumvention investigation, interconnection issues, and long timelines for new community solar policy and rulemaking.
The most significant state-level changes have been made to forecasts for New Jersey, Virginia, and Illinois. We have decreased the near-term New Jersey outlook by nearly 50%. The transition to a permanent program means that it is unlikely that any capacity will be awarded in 2022. Meanwhile, Virginia’s community solar program faces uncertainty due to a very high proposed minimum bill charge. Reductions in the forecast are partially offset by significant increases to the Illinois forecast thanks to firm expectations for future Adjustable Block Program years.
New AD/CVD tariffs would increase module pricing for the community solar segment. The Low case for community solar shows a 7% decline compared to the Base case from 2022-2027. The uncertainty related to the anti-circumvention investigation has prevented some developers from acquiring enough equipment to build projects this year. This has led to near-term downward revisions across all community solar states. The High case would add 166 MWdc (3%) of additional upside for 2022-2027 compared to the Base case.
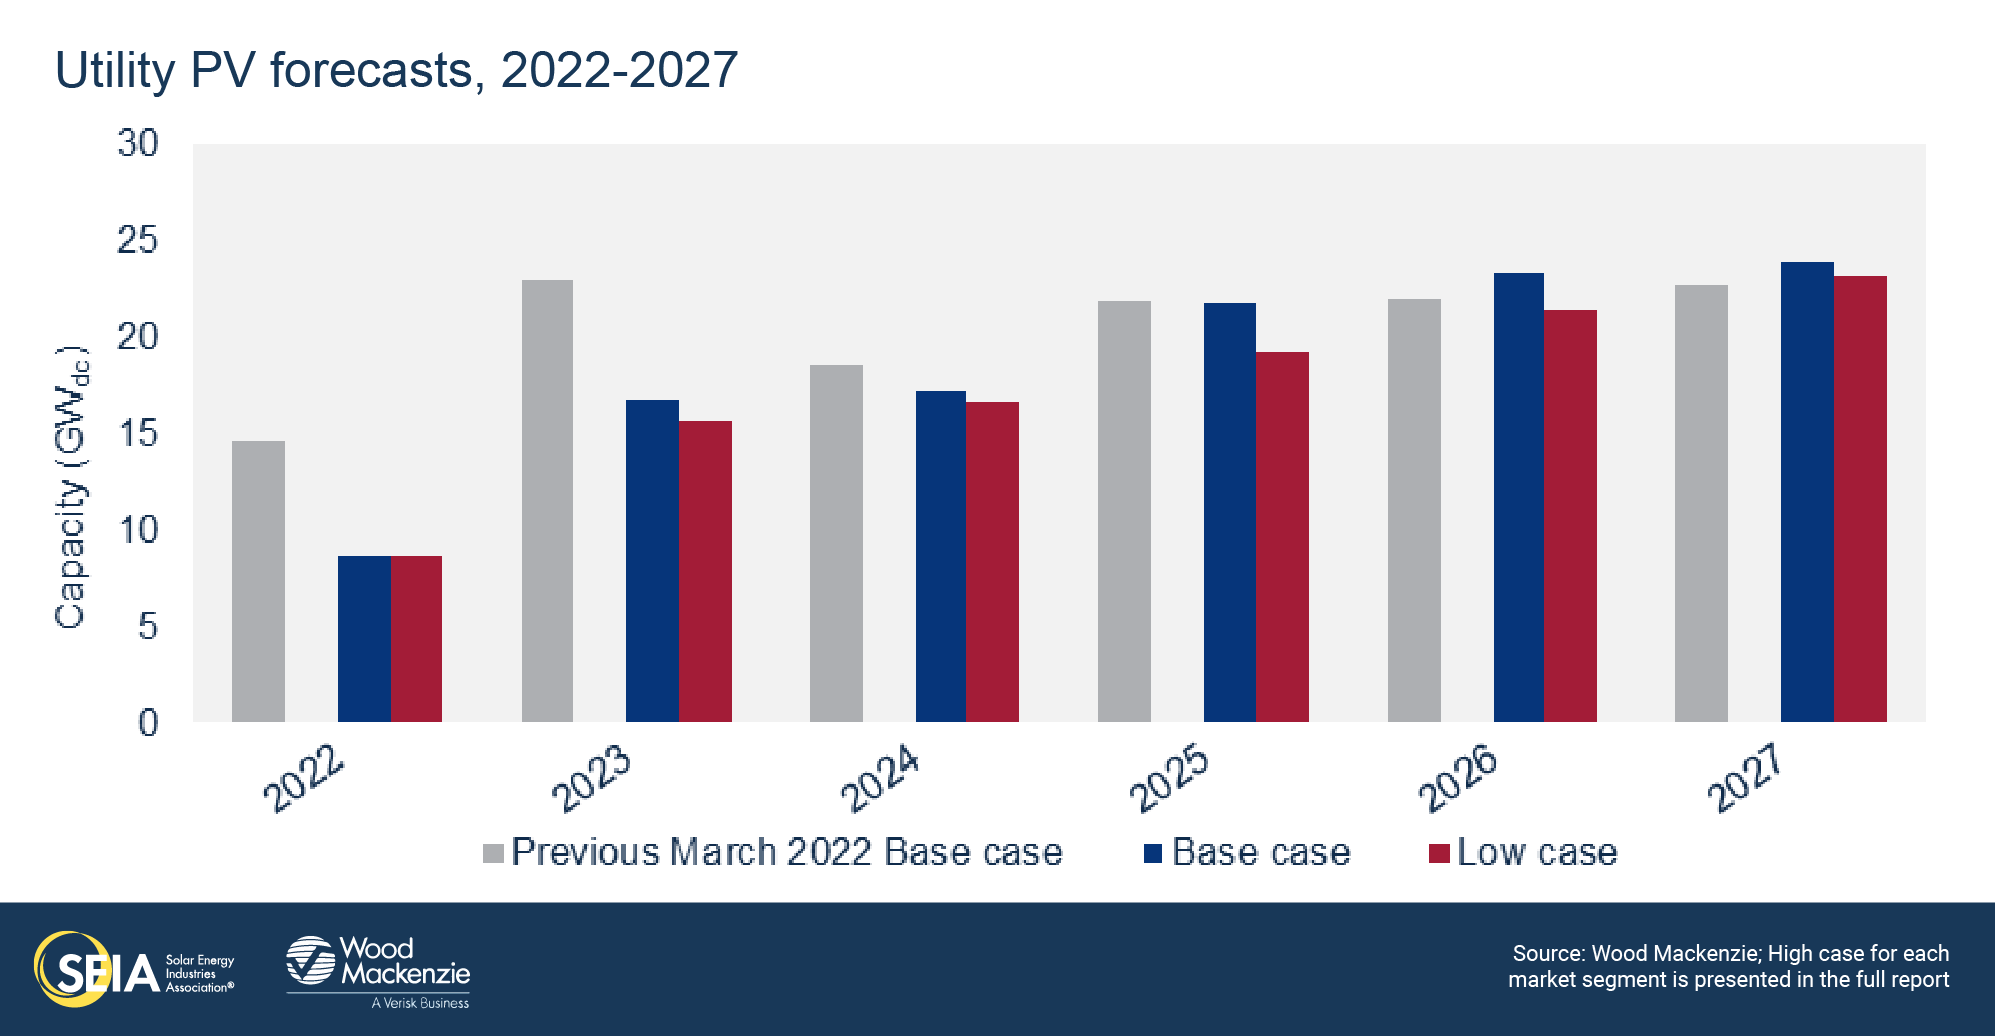
3.4. Utility PV
Key figures
- 2,173 MWdc installed in Q1 2022
- 112 GWdc of utility-scale solar will be added from 2022-2027 in the Base case, an 11 GWdc reduction compared to last quarter’s forecast
Multiple headwinds in the solar industry took a toll on the utility-scale segment. Q1 2022 was the lowest quarter on record since 2019, with 2.2 GWdc installed. During Q1, 2.4 GWdc of new contracts were signed – the fewest since 2017 – resulting in the contracted pipeline growing only slightly to 80.6 GWdc. There are currently 26 GWdc of projects under construction, 15.7 GWdc of which were originally slated to come online this year.
However, utility-scale solar continues to be heavily impacted by high commodity prices and supply chain constraints, which have been exacerbated by the anti-circumvention investigation. The investigation has further reduced shipments to the US that were first observed last quarter. Project development activity has also taken a pause in recent weeks, as developers struggle to quote firm PPA prices or CODs. These factors led to an astounding 6 GWdc (41%) downgrade to the already-low 14.7 GWdc 2022 forecast since last quarter, for an updated 2022 outlook of 8.7 GWdc.
While interest from utility and corporate customers continues to be high, the utility-scale solar pipeline took a hit from the anti-circumvention investigation – 17.6 GWdc of projects in development were delayed by at least a year, and 450 MW of projects were canceled outright. The outcome of the anti-circumvention investigation and the potential extension of tax credits will ultimately determine the number of projects that will come to fruition. The Low case scenario will result in a 7 GWdc downgrade compared to the Base case for 2022-2027. The High case, on the other hand, will add 47 GWdc (42%) of additional upside for 2022-2027 compared to the Base case.
4. U.S. solar PV forecasts
Base case forecasts
Low case forecasts (AD/CVD tariffs imposed)
5. National solar PV system pricing
Note: Wood Mackenzie has updated the reporting methodology for modeled prices to be consistent with the US solar system pricing reports. Therefore, figures shown below may not match those published in earlier editions of the US Solar Market Insight report.
Wood Mackenzie employs a bottom-up modeling methodology to capture, track and report national average PV system pricing by segment for systems installed each quarter. The methodology is based on the tracked wholesale pricing of major solar components and data collected from industry interviews. We report a weighted average of standard mono-PERC and high-efficiency modules for all market segments. Wood Mackenzie assumes all product is procured and delivered in the same year as the installation.
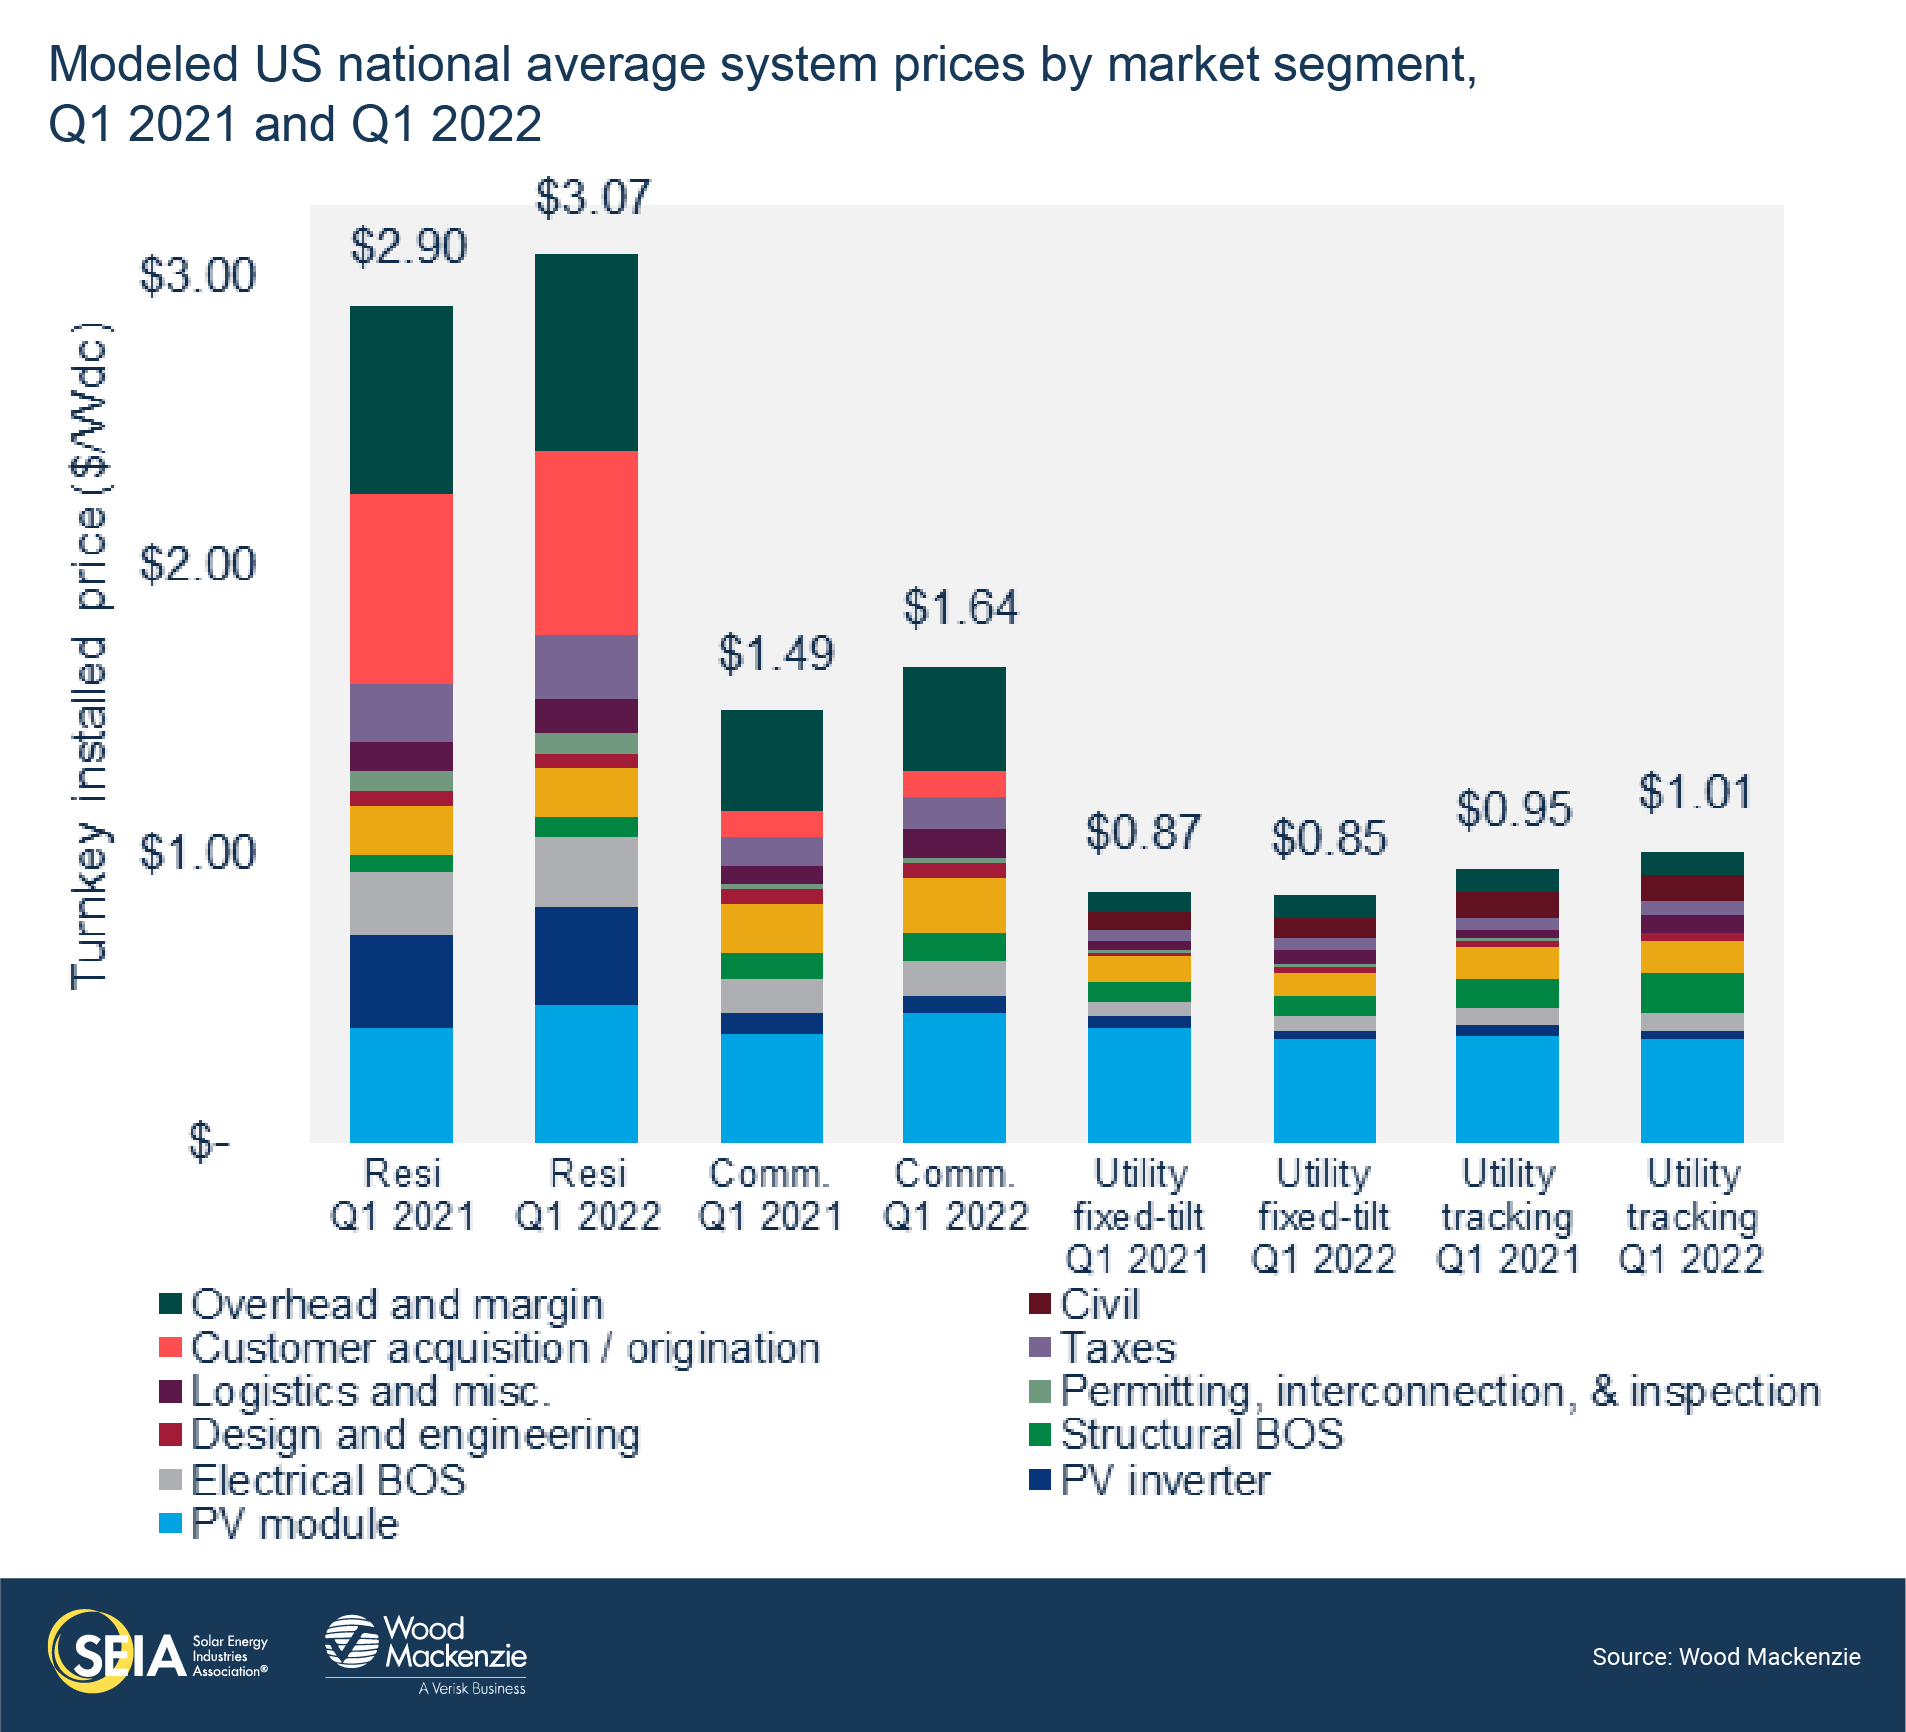
In Q1 2022, national system pricing increased across all market segments year-over-year, except in the utility fixed-tilt market. Despite rising component pricing, the rate of overall system cost increases slowed down this quarter compared to Q4 2021. The adoption of high-power class modules and the increasing power density of inverters helped mitigate elevated commodity costs. System pricing increased year-over-year by 6% for residential, 10% for commercial, and 6% for utility single-axis tracking solar but decreased by 2% for fixed-tilt utility projects (which more often use mono perc modules that have come down in price). Most utility-scale solar projects installed today utilize single-axis tracking.
5. Manufacturing
Beginning with the Q2 2022 report, Wood Mackenzie will be including data on US-based module manufacturing facilities. Since the domestic solar supply chain continues to be an important element of policy discussions, this additional granularity is meant to bring additional insight to the industry. This data is included in this Executive Summary and will be available only within the full report beginning next quarter. If you have facility-level data you wish to provide, please reach out to [email protected].
At present, the US has around 11 GWdc of module manufacturing capacity, as shown in the table below. In 2021, announcements of new manufacturing capacity plans across the supply chain became increasingly common as suppliers positioned themselves to take advantage of the potential manufacturing tax credits available in the Solar Energy Manufacturing Act (SEMA). SEMA has not yet been enacted but is part of the reconciliation bill currently under consideration.
Of the announced capacity expansion plans over the past year, only a few have come to fruition thus far. Heliene, Silfab, and First Solar successfully opened new module manufacturing facilities in 2021. All other suppliers’ announced capacity expansion plans hinge upon the passage of SEMA.
About the Report
U.S. solar market insight® is a quarterly publication of Wood Mackenzie and the Solar Energy Industries Association (SEIA)®. Each quarter, we collect granular data on the U.S. solar market from nearly 200 utilities, state agencies, installers and manufacturers. This data provides the backbone of this U.S. Solar Market Insight® report, in which we identify and analyze trends in U.S. solar demand, manufacturing and pricing by state and market segment over the next five to ten years. All forecasts are from Wood Mackenzie, Limited; SEIA does not predict future pricing, bid terms, costs, deployment or supply. The report includes all 50 states and Washington, D.C. National totals reported also include Puerto Rico and other U.S. territories. Detailed data and forecasts for 50 states and Washington, D.C. are contained within the full version of the report.
References and Contact
-
References, data, charts and analysis from this executive summary should be attributed to “Wood Mackenzie/SEIA U.S. solar market insight®.”
-
Media inquiries should be directed to Wood Mackenzie’s PR team ([email protected]) and Morgan Lyons ([email protected]) at SEIA.
-
All figures are sourced from Wood Mackenzie. For more detail on methodology and sources, click here.
About the Authors
Wood Mackenzie Power & Renewables | U.S. Research Team
Michelle Davis, Principal Analyst (lead author)
Bryan White, Solar Analyst
Rachel Goldstein, Solar Analyst
Sylvia Leyba Martinez, Senior Analyst
Sagar Chopra, Solar Analyst
Kelsey Gross, Solar Analyst
Matthew Sahd, Research Associate
Xiaojing Sun, Head of Global Solar
Solar Energy Industries Association | SEIA
Shawn Rumery, Director of Research
Colin Silver, Chief of Staff and Chief Content Officer
Justin Baca, Vice President of Markets & Research
Note on U.S. solar market insight report title: The report title is based on the quarter in which the report is released, not the most recent quarter of installation figures.
License
Ownership rights
This report ("Report") and all Solar Market Insight® ("SMI")TM reports are jointly owned by Wood Mackenzie and the Solar Energy Industries Association (SEIA)®(jointly, "Owners") and are protected by United States copyright and trademark laws and international copyright/intellectual property laws under applicable treaties and/or conventions. Purchaser of Report or other person obtaining a copy legally ("User") agrees not to export Report into a country that does not have copyright/intellectual property laws that will protect rights of Owners therein.
Grant of license rights
Owners hereby grant user a non-exclusive, non-refundable, non-transferable Enterprise License, which allows you to (i) distribute the report within your organization across multiple locations to its representatives, employees or agents who are authorized by the organization to view the report in support of the organization’s internal business purposes, and (ii) display the report within your organization’s privately hosted internal intranet in support of your organization’s internal business purposes. Your right to distribute the report under an Enterprise License allows distribution among multiple locations or facilities to Authorized Users within your organization.
Owners retain exclusive and sole ownership of this report. User agrees not to permit any unauthorized use, reproduction, distribution, publication or electronic transmission of any report or the information/forecasts therein without the express written permission of Owners.
Disclaimer of warranty and liability
Owners have used their best efforts in collecting and preparing each report.
Owners, their employees, affiliates, agents, and licensors do not warrant the accuracy, completeness, correctness, non-infringement, merchantability, or fitness for a particular purpose of any reports covered by this agreement. Owners, their employees, affiliates, agents, or licensors shall not be liable to user or any third party for losses or injury caused in whole or part by our negligence or contingencies beyond Owners’ control in compiling, preparing or disseminating any report or for any decision made or action taken by user or any third party in reliance on such information or for any consequential, special, indirect or similar damages, even if Owners were advised of the possibility of the same. User agrees that the liability of Owners, their employees, affiliates, agents and licensors, if any, arising out of any kind of legal claim (whether in contract, tort or otherwise) in connection with its goods/services under this agreement shall not exceed the amount you paid to Owners for use of the report in question.