Solar Market Insight 2015 Q3
Purchase the Full Report | Press Release
The quarterly SEIA/GTM Research U.S. Solar Market Insight™ report shows the major trends in the U.S. solar industry. Learn more about the U.S. Solar Market Insight Report.
Key Figures
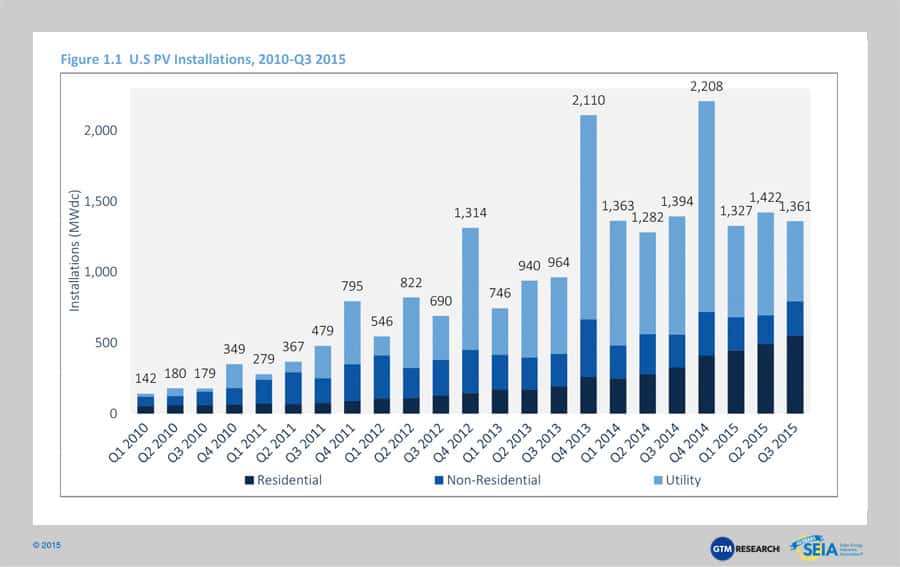
- The U.S. installed 1,361 MWdc of solar PV in Q3 2015, marking the eighth consecutive quarter in which the U.S. added more than 1 GWdc of PV installations.
- Throughout the first three quarters of 2015, 30% of all new electric generating capacity brought on-line in the U.S. came from solar.
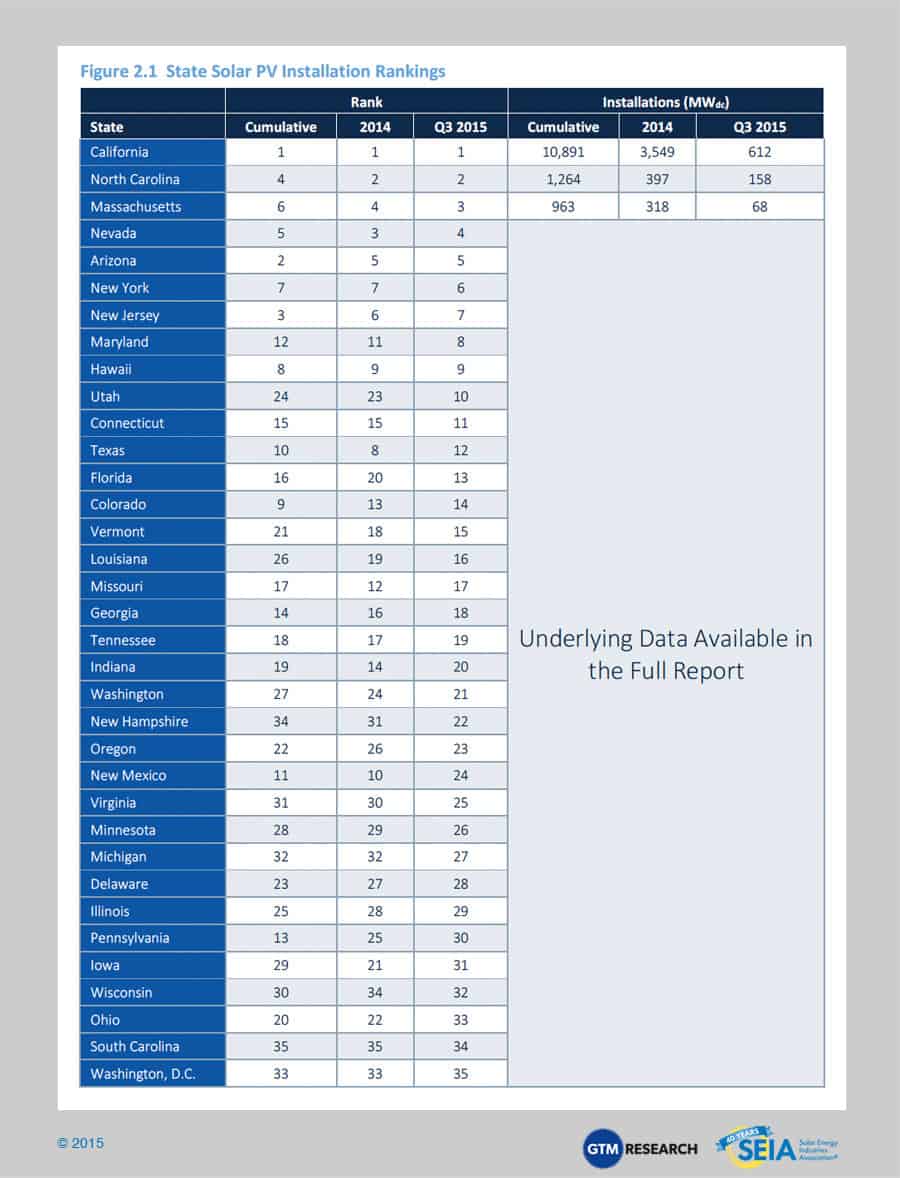
- As of Q3 2015, more than 50% of all states in the U.S. have more than 50 MWdc of cumulative solar PV installed.
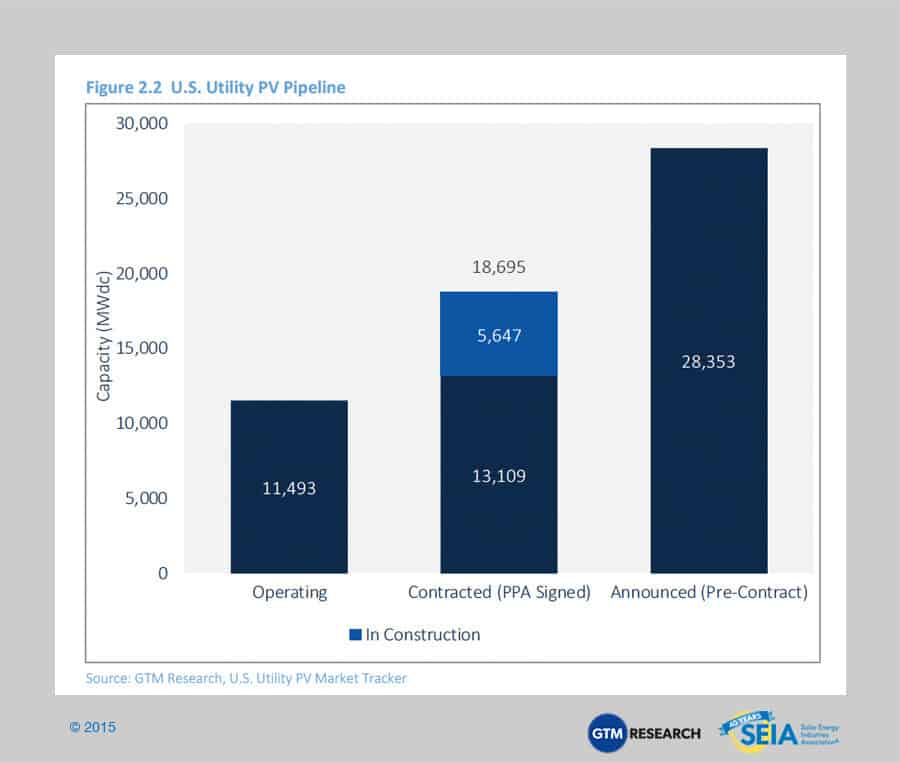
- Totaling 18.7 GWdc, the current utility PV development pipeline is greater than all U.S. PV installations brought on-line through the end of 2014.
- GTM Research forecasts that 7.4 GWdc of new PV installations will come on-line in 2015, up 19% over 2014. Growth will occur in the residential and utility PV segments, while for the second straight year, non-residential solar will dip 5%.
- 2014 was the largest year ever for concentrating solar power, with 767 MWac brought on-line. The next notable CSP project slated for completion is SolarReserve’s 110 MWac Crescent Dunes project, which is expected to become fully operational by early 2016.
1. Introduction
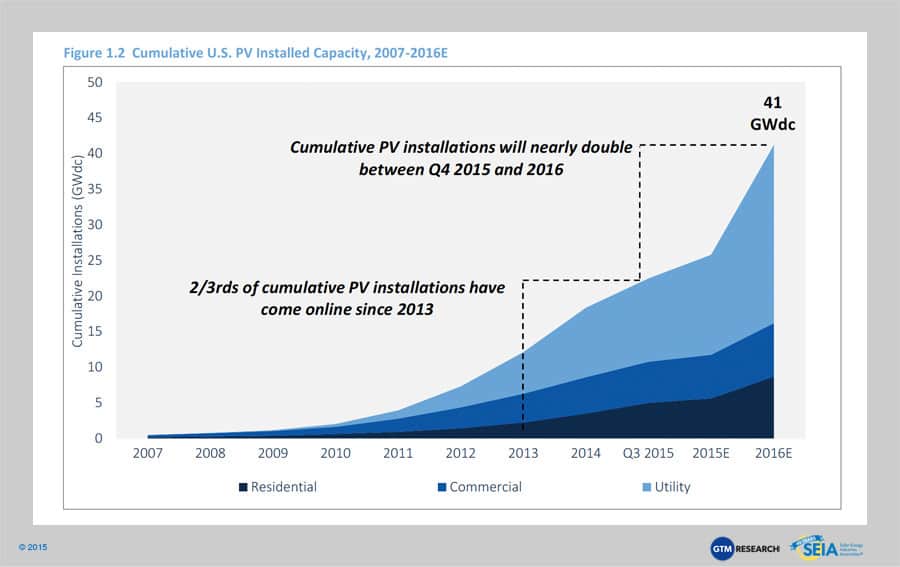
The U.S. solar market remains on track for a record-breaking year, with 1,361 MWdc installed during Q3 2015, bringing the market up to 4.1 GWdc through the first three quarters of 2015. Thanks to a booming residential PV market and continued realization of the utility sector’s double-digit gigawatt project pipeline, Q3 2015 marks the eighth consecutive quarter in which the U.S. added more than 1 GWdc of solar PV.
Over the next 12 months, however, 1 GWdc will serve as a distant floor for quarterly U.S. PV installation volumes. Headlined by the utility PV segment, we expect the U.S. solar market to experience a record-breaking Q4 2015, with more than 3 GWdc of solar installations. In 2016, developers will have a laser-like focus on project build-out in order to qualify for the 30% federal Investment Tax Credit, which is scheduled to step down to 10% for utility, commercial, and third-party-owned residential PV, and to expire altogether for direct-owned residential PV on January 1, 2017. This focus on project build-out and pipeline pull-in has increased dramatically to the point where GTM Research is now forecasting more than 15 GWdc to come on-line in 2016 alone, and between Q4 2015 and Q4 2016, cumulative U.S. PV installations are poised to nearly double, eclipsing the 40 GWdc mark for operating solar PV capacity.

But in a world where the 30% federal ITC does ultimately drop to 10% for commercial, utility and third-party-owned systems and 0% for direct-owned residential PV, the road to market recovery across distributed and utility PV will be shaped by numerous upside drivers and downside risks that extend beyond the next 12 months of heated legislative battles in Washington, D.C. Without an extension of the ITC, it will take four years for the industry to recover to being a 10 GWdc+ annual market after first achieving this feat in 2016.
Between now and 2020, as the U.S. solar market navigates the uncertainty of the 30% federal ITC’s future, it is worth considering the next order of magnitude for solar in the U.S. What does that really mean and how can the industry bring it closer?
1.1 In Focus: From 25 GW dc to 250 GWdc - Exploring the Next Order of Magnitude for U.S. Solar
Over the next few months, the U.S. solar market will reach two symbolic milestones. First, early next year, the millionth solar installation will begin operation. Second, around the end of this year, solar will begin generating over 1% of all electricity in the country. That 1% compromises more power than the state of Nevada consumes in an entire year.
Yet solar still has a way to go to fundamentally change the generation mix or to significantly impact U.S. greenhouse gas emissions.
So what does the next order of magnitude look like for U.S. solar?
Let’s use 250 GWdc as a rough benchmark, since cumulative capacity at the end of this year will just exceed 25 GWdc. Assuming incremental increases in solar performance, this should equate to around 10% of all electricity generation in the U.S. And if average system sizes hold steady, this means nearly 10 million individual installations. But what drivers could fuel a tenfold increase in solar deployment over the next decade? The four major upside drivers are outlined below.
1. Electricity Prices Will Probably Continue to Rise
Every time retail electricity prices increase, distributed solar becomes more attractive for two reasons. First, solar looks better to the customer in an immediate sense – solar providers can offer greater savings, shorter payback periods, and better returns. Second, solar’s value proposition as a hedge against continually rising electricity prices becomes more apparent with each electricity price hike.
2. Solar Prices Will Probably Continue to Fall
While electricity prices are likely to keep rising over the coming decades, solar prices will continue to fall. To be clear, it would be unrealistic to expect the cost of solar to decline over the next decade at the same rate that it has over the previous decade. But there is still plenty of headroom in system prices – hardware can still be optimized and made more efficient, while a variety of soft-cost reductions remain unrealized.
3. The Clean Power Plan Could Open Up New Markets
In the short term, the Clean Power Plan may unintentionally dampen solar demand through 2019 (given compliance plan timelines, unless the pre-compliance Clean Energy Incentive Program is revised), but in the long term, the CPP provides enormous potential to support the expansion of solar in the U.S. The 10 states with the largest GHG reduction requirements by 2030 under the CPP account for less than 2% of operating solar in the U.S. In other words, these states (with the exception of Colorado) have virtually no solar market today, and solar may be an attractive component of their aggressive GHG reduction compliance requirements. Moreover, the EPA and other analyses of the CPP have shown a significant increase in solar deployment under the plan. ERCOT’s analysis of the CPP had the capacity expansion model routinely running into a hard cap on annual solar builds coded into the model.

4. Market Reinvention dia DER Aggregation May Open Up New Revenue Streams
A final tailwind for solar could come in the form of new sources of revenue, particularly for behind-the-meter (distributed) projects. Today, these projects essentially receive a single value stream: the reduction of a customer’s bill via a combination of self-consumption of solar power and net energy metering for power fed back into the grid. But solar ultimately has greater value – specifically, value to the grid. Especially when paired with energy storage, load control and other distributed energy resources (DERs), solar can be a valuable component of tomorrow’s grid-responsive building.
This additional revenue could be used to open up otherwise-unattractive markets, or it could be passed on to the customer. Regardless, DER aggregation for grid services may present the most significant new opportunity for distributed solar in years with the right regulatory environment.
But this vision of dramatic solar growth throughout the country for the next 10 to 15 years is no foregone conclusion. While the solar market does have momentum and the factors mentioned above on its side, there are a number of meaningful roadblocks threatening to derail growth.
- Recovery from 30% ITC expiration could be slow: While GTM Research’s base-case forecast calls for each market segment to grow year-over-year in 2018 after a crash in 2017, downside drivers including abrupt elimination of major state incentive programs, delayed procurement plans trigged by the CPP, and stark reforms to rate design and distributed PV net-metering policies could mean slower-than-expected recovery timelines if the 30% federal ITC ultimately steps down.
- Rate design and net energy metering reforms could still erode distributed solar economics: The distributed solar market is expected to remain a geographically consolidated market. As such, major decisions on the future of NEM in a handful of state markets, such as one scheduled to be announced this month (December 2015) n California, will play a leading role in supporting the near-term growth trajectory of national distributed PV installations.
- As solar penetration grows, its value to the grid shrinks: In the long run, however, as solar becomes a mainstream power source, regulators and utilities are more likely to align solar compensation closer to wholesale market pricing. Just as importantly, solar on its own will deliver less value to the grid as its penetration increases by providing power during times of over-generation rather than times of particular need. As solar adoption takes off, if compensation tracks solar’s value, then solar owners could experience declining revenues. Energy storage and load-shifting both present opportunities to mitigate this effect, and both will be vital to solar’s future.
The factors mentioned above, both positive and negative, likely will not come as news to the solar industry. But many of them likely seem like distant concerns, to be dealt with after the next quarter, the next year, or the next business cycle. We believe these are relevant considerations to monitor today, both in established markets like California, where proceedings are deciding the long-term future of net metering and rate design, to more nascent markets like Texas, where efforts are underway to promote DER aggregation. With that in mind, GTM Research and SEIA are keeping tabs on these trends that can accelerate the tailwinds and counter the barriers to enable solar’s growth through 2020 and beyond.
2. Photovoltaics
2.1 Market Segment Trends
Residential PV
Key Figures
- Up 12% over Q2 2015
- Up 69% over Q3 2014
Continuing a well-established trend, residential PV once again posted a new record quarterly total in Q3 2015, growing 12% quarter-over-quarter and 69% year-over-year. California’s share of the national market once again fell slightly, but still accounted for 48% of Q3 installations. Most major state markets saw quarterly growth as well – including Massachusetts, New Jersey and Maryland – while New York saw a decline in quarterly installations. Notably, Nevada’s market nearly quadrupled its installations over Q2 2015, marking the state’s ascension to the top five in total installed capacity for 2015.
Non-Residential PV
Key Figures
- Up 19% over Q2 2015
- Up 4% over Q3 2014
Despite non-residential PV experiencing a strong rebound from the preceding quarter, which saw the lowest installation volumes in the past several years, Q3 2015 installations barely grew year-over-year. California primarily drove the non-residential market in an otherwise weak quarter, adding more than 100 MWdc – a feat achieved only twice before (once by California and once by New Jersey). Meanwhile, most other major non-residential markets faltered, with Hawaii and New Jersey being the only other top 10 states to post positive growth on the quarter.
Utility PV
Key Figures
- 10th consecutive quarter in which utility PV added at least 500 MWdc
- Contracted utility PV pipeline currently totals 18.7 GWdc
The utility PV market continues to serve as the bedrock driver of installation growth in the U.S. solar market, accounting for 42% of capacity installed in Q3 2015. And the market is on the precipice of unprecedented growth through 2016, with more than 10 GWdc expected to come on-line in 2016 alone. This growth is partly pegged to the recent wave of centralized PV procurement by utilities and other buyers of power without a renewable portfolio standard (RPS).
With PPA prices for utility-scale solar now ranging between $40/MWh and $60/MWh, utility PV’s value proposition is evolving beyond simply meeting an RPS obligation. On top of RPS-driven demand, centralized PV is proving to be an economically competitive resource to meet utilities’ peak power needs. This is especially true in regions like Texas and the Southeast, where utilities are retiring their aging coal fleets and replacing them with utility PV alongside combined-cycle natural gas plants.
Corporations and other large institutions have played a larger role in the procurement of offsite, centralized solar projects as well. Such retail customers’ ability to procure large-scale projects stems from a few creative solutions, including direct access legislation, partnerships with utilities to launch green tariffs for one project and one customer, and financial hedge contracts for projects that sell power directly into a real-time, wholesale energy market.
2.2 National Solar PV System Pricing
We utilize a bottom-up modeling methodology to track and report national average PV system pricing for the major market segments. Though we continue to solicit weighted-average system pricing directly from utility and state incentive programs, we believe that this data no longer accurately reflects the current state of system pricing, as more systems forego local incentives and data from these sources often represent pricing quoted well prior to the installation and connection date.
Our bottom-up methodology is based on tracked wholesale pricing of major solar components and data collected from interviews with major installers, supplemented by data collected from utility and state programs.

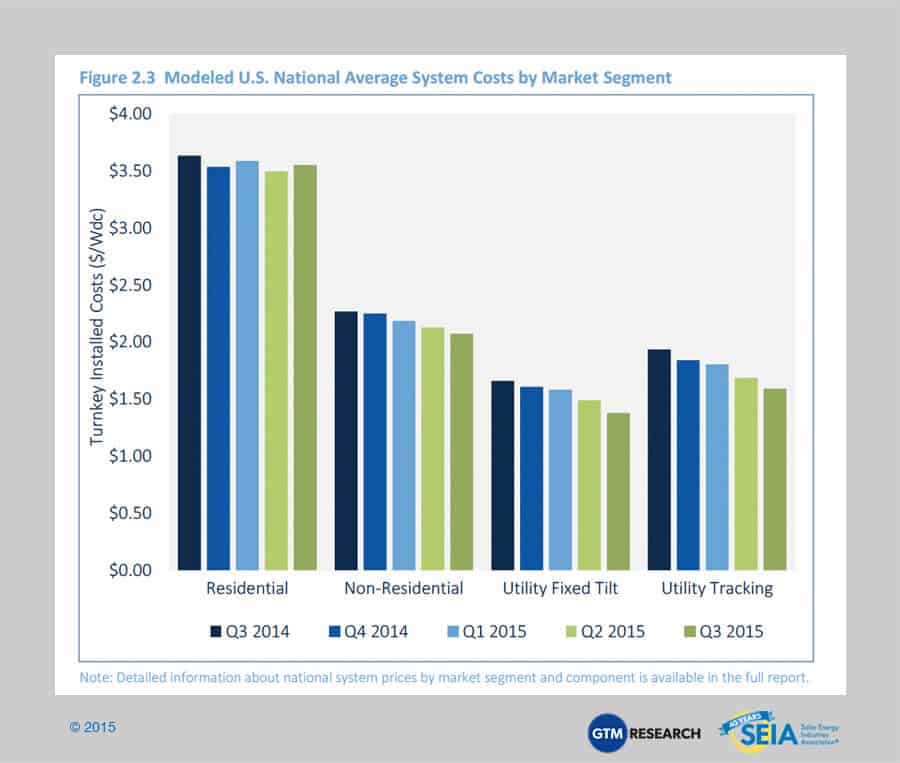
Year-over-year, overall system pricing has fallen by 2% to 18%, depending on the market segment, with the largest declines in ground mount PV. On a quarterly basis, pricing continues to trend downward with some leveling-off in the residential sector due in particular to strong investment in customer acquisition ahead of 2016. In the non-residential and utility sectors, we see declines of 3% to 7%, reflecting continued aggressive cost reductions in national system pricing on an aggregate basis. Markets with a large footprint, such as California, continue to have a disproportionate effect on overall national average pricing, which can vary by as much as 20% from state to state. Variations in utility system costs are much smaller than variations in residential and non-residential costs.
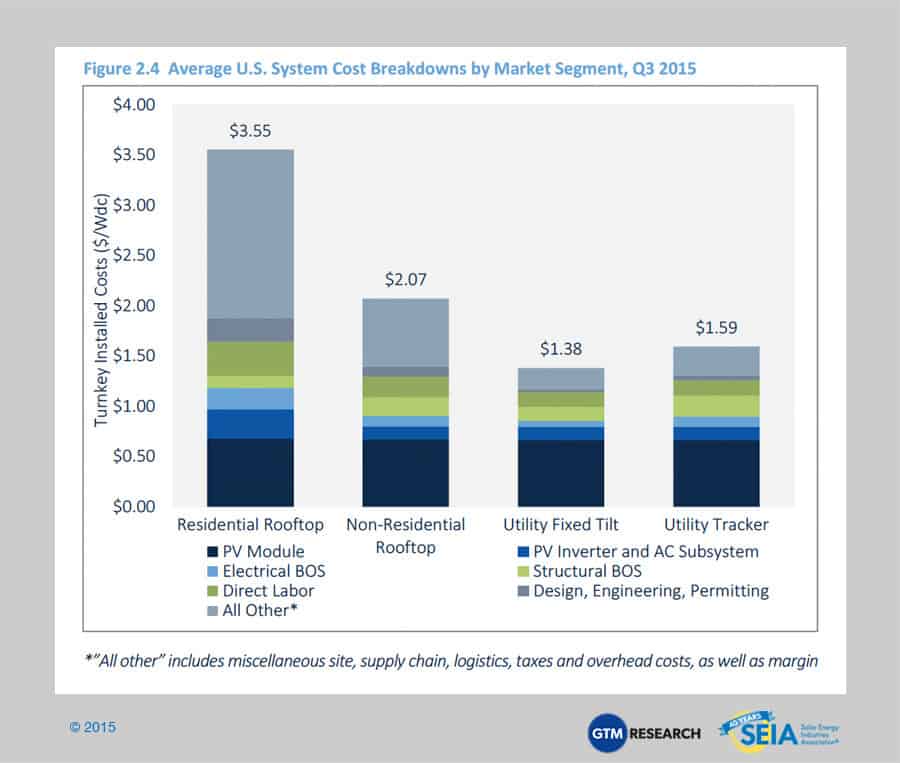
Average pricing for residential rooftop systems landed just above $3.50/Wdc, with nearly 60% of costs coming from on-site labor, engineering, permitting and other soft costs. While residential hardware costs have fallen by over 14% in the past year, soft costs have actually risen on an industry average basis by 6%. The trend is indicative of persistent challenges in lowering permitting costs and rising expenditures in customer acquisition that have not yet yielded additional installed capacity. As the industry continues to consider market expansion, these soft costs remain under intense scrutiny by large and small installers alike.
While utility system pricing is more tightly clustered than residential and non-residential system prices, state-by-state variation is prevalent, with states in the Southeast U.S. leading on lowest system costs. In Q3 2015, a high proportion of projects located in North Carolina with lower costs (especially in regards to labor) played a significant role in bringing national pricing downward for utility fixed-tilt systems. However, utility EPCs and developers continue to leverage a heavily competitive supply chain and maturing system installation practices to reduce costs across the board.
2.3 Component Pricing
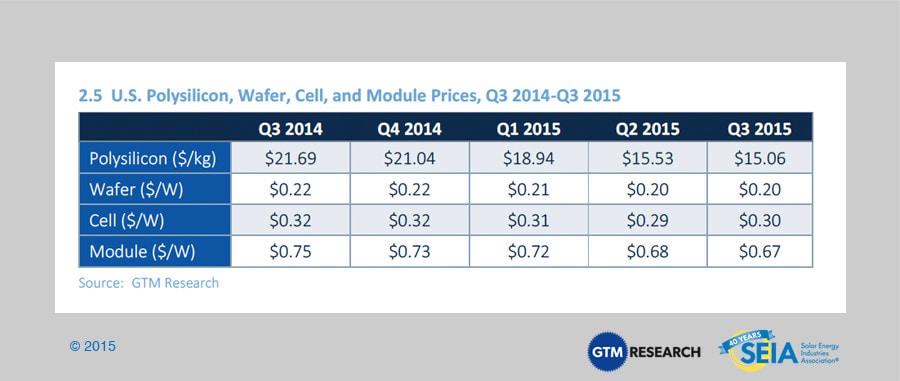
Compared to the first half of the year, the price trend for polysilicon and PV components was relatively stable in Q3 2015.
- For polysilicon, prices fell a 3% sequentially to $15.06/kg in Q3 2015. This is compared to the 18% drop in Q2 2015. The moderate decline was in part due to a drop in inventory levels for polysilicon producers and buyers (wafer producers).
- Wafer prices were also driven by healthier inventory levels, allowing quarterly prices to remain static at $0.20/W in Q3 2015.
- Cells were the only component to see a price uptick. Driven by stronger end-market demand, cell prices grew 2% to $0.30/W in Q3 2015.
U.S. module prices are largely driven by antidumping and countervailing duties on Chinese suppliers. In July 2015, the U.S. Department of Commerce filed its final review of the import tariffs on Chinese cells into the U.S. market. The final ruling set the cumulative duty at 30.61% for most major suppliers (21.70% for Yingli). During the third quarter, the average delivered priced for Chinese modules ranged from $0.65/W on the low side (corresponding to order volumes greater than 10 MW for less established firms) to $0.67/W on the high side (established, bankable firms, order volumes of less than 1 MW).

2.4 Market Outlook
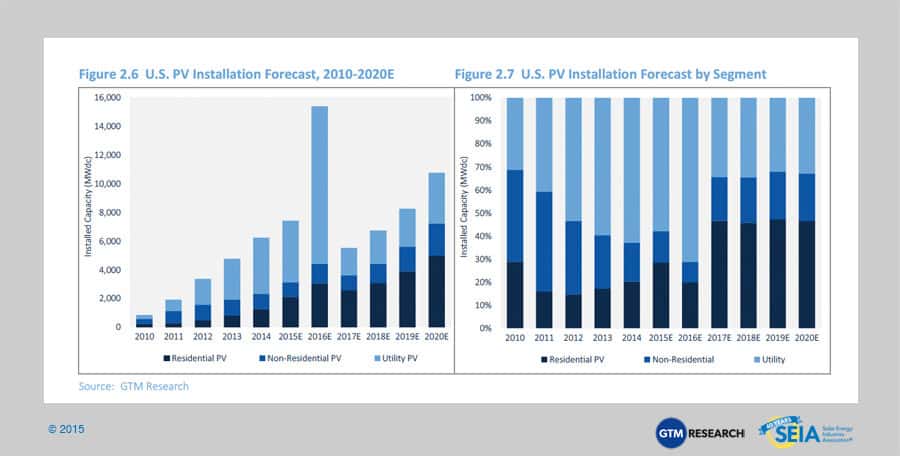
We expect another record year for the U.S. PV market in 2015, with installations reaching 7.4 GWdc, a 19% increase over 2014. The fastest growth will come from the residential segment, which is on pace to add more than 2 GWdc for the first time ever, following a year in which the segment installed more than 1 GWdc for the first time. Meanwhile, the non-residential PV market continues to struggle to scale as state incentive funding declines, and for the second straight year the segment is expected to fall slightly (5% downturn). Lastly, utility PV is forecasted to grow by 9% and should fuel more than 50% of all installations brought on-line for the fourth consecutive year.
As mentioned, on January 1, 2017, the 30% federal Investment Tax Credit (ITC) is scheduled to drop to 10% for third-party-owned residential, non-residential, and utility PV projects under Section 48 of the tax code, while the credit for direct purchases of residential PV under Section 25d is scheduled to expire entirely. Given that, solar installers and developers will aim to bring as much capacity on-line as possible before the scheduled stepdown. Solar development will continue, but some markets will fare better than others, and resumption of growth after 2017 will look different from the growth seen over the past eight years. For all market segments, the total addressable market will shrink post-2016, some states will fall off the solar map entirely, and resumption of growth at a national level will be due to several states with strong economics.
The utility-scale market shows the most dramatic drop in 2017, not only because of the challenges posed by the lower ITC, but also because project developers have largely turned their attention to bringing their contracted projects on-line before the end of 2016 in order to capture the full 30% credit. Many of these projects have long-term PPAs that begin in 2017 or later but will sell electricity either through short-term PPAs or on the spot market to bridge the gap between their commercial operation date and the beginning of their long-term PPAs. This pull-in of the utility solar pipeline will render the ITC cliff dramatic. Overall, installations are expected to drop 64% in 2017.
Forecast details by state (34 states plus Washington, D.C.) and market segment through 2020 are available in the full report.

3. Concentrating Solar Power
The final quarter of 2013 kicked off the first wave of mega-scale CSP projects to be completed over the next few years, and Q1 2014 built on that momentum with 517 MWac brought on-line. This included BrightSource Energy’s 392 MWac Ivanpah project and the second and final 125 MWac phase of NextEra’s Genesis solar project. While Q2 2014 and Q3 2014 were dormant for CSP, Abengoa finished commissioning its 250 MWac Mojave Solar project in December 2014. As a result, 2014 ranked as the largest year ever for CSP, with 767 MWac brought on-line. The next notable project slated for completion is SolarReserve’s 110 MWac Crescent Dunes project, which entered the commissioning phase in February 2014, then entered the testing phase in October 2015, and is now expected to become fully operational by early 2016.
After Crescent Dunes comes on-line, growth prospects for the CSP market in the U.S. are bleak. On one hand, CSP paired with storage represents an attractive generation resource for utilities, offering a number of ancillary and resource-adequacy benefits. However, due to extensive permitting hurdles that have confronted CSP projects, developers are putting their CSP pipelines on hold given the short window to bring projects on-line before the federal ITC is scheduled to drop at the end of 2016. Most notably, Abengoa’s Palen Solar project, BrightSource’s Hidden Hills project, and SolarReserve’s Rice Solar project are all delayed indefinitely.
Beyond 2016, the outlook for the CSP market will depend on further progress made toward mitigating early-stage development hurdles, lowering hardware costs, and strengthening the ancillary and capacity benefits provided by CSP paired with storage.
Acknowledgments
U.S. Solar Market Insight® is a quarterly publication of GTM Research and the Solar Energy Industries Association (SEIA)®. Each quarter, we collect granular data on the U.S. solar market from nearly 200 utilities, state agencies, installers and manufacturers. This data provides the backbone of this U.S. Solar Market Insight® report, in which we identify and analyze trends in U.S. solar demand, manufacturing and pricing by state and market segment. We also use this analysis to look forward and forecast demand over the next five years. All forecasts are from GTM Research; SEIA does not predict future pricing, bid terms, costs, deployment or supply.
- References, data, charts and analysis from this executive summary should be attributed to “GTM Research/SEIA U.S. Solar Market Insight®.”
- Media inquiries should be directed to Mike Munsell ([email protected]) at GTM Research and Alexandra Hobson ([email protected]) at SEIA.
- All figures are sourced from GTM Research. For more detail on methodology and sources, visit www.gtmresearch.com/solarinsight.
Our coverage in the U.S. Solar Market Insight reports includes 34 individual states and Washington, D.C. However, the national totals reported include all 50 states, Washington, D.C., and Puerto Rico.
Detailed data and forecasts for 34 states and Washington, D.C. are contained within the full version of this report, available at www.greentechmedia.com/research/ussmi
AUTHORS
GTM Research | U.S. Research Team
Shayle Kann, Senior Vice President
MJ Shiao, Director of Solar Research
Cory Honeyman, Senior Solar Analyst (lead author)
Jade Jones, Senior Solar Analyst
Austin Perea, Solar Analyst
Colin Smith, Solar Analyst
Solar Energy Industries Association | SEIA
Tom Kimbis, Vice President of Executive Affairs
Justin Baca, Senior Director of Research
Shawn Rumery, Director of Research
Aaron Holm, Senior Research Analyst