Solar Market Insight Report 2021 Year in Review
The quarterly SEIA/Wood Mackenzie Power & Renewables U.S. Solar Market InsightTM report shows the major trends in the U.S. solar industry. Learn more about the U.S. Solar Market Insight Report. Released March 10, 2022.
1. Key Figures
- In 2021, the US solar market installed a record 23.6 GWdc of solar capacity, a 19% increase over 2020.
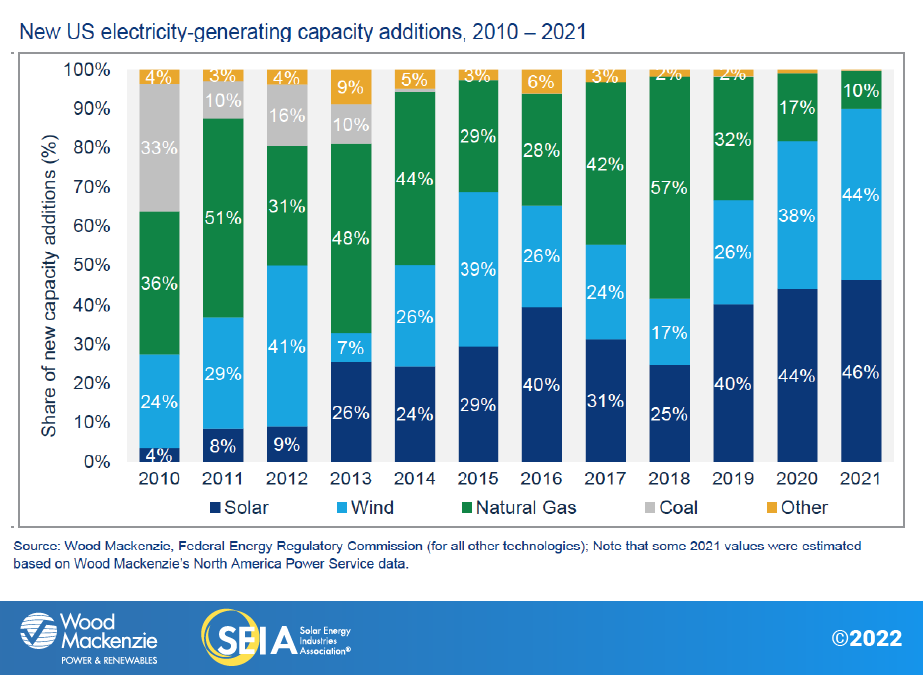
- Solar accounted for 46% of all new electricity-generating capacity added in the US in 2021. This represents the third year in a row that solar has made up the largest share of new generating capacity in the US. In 2021, 3.9% of all US electricity generation came from solar.
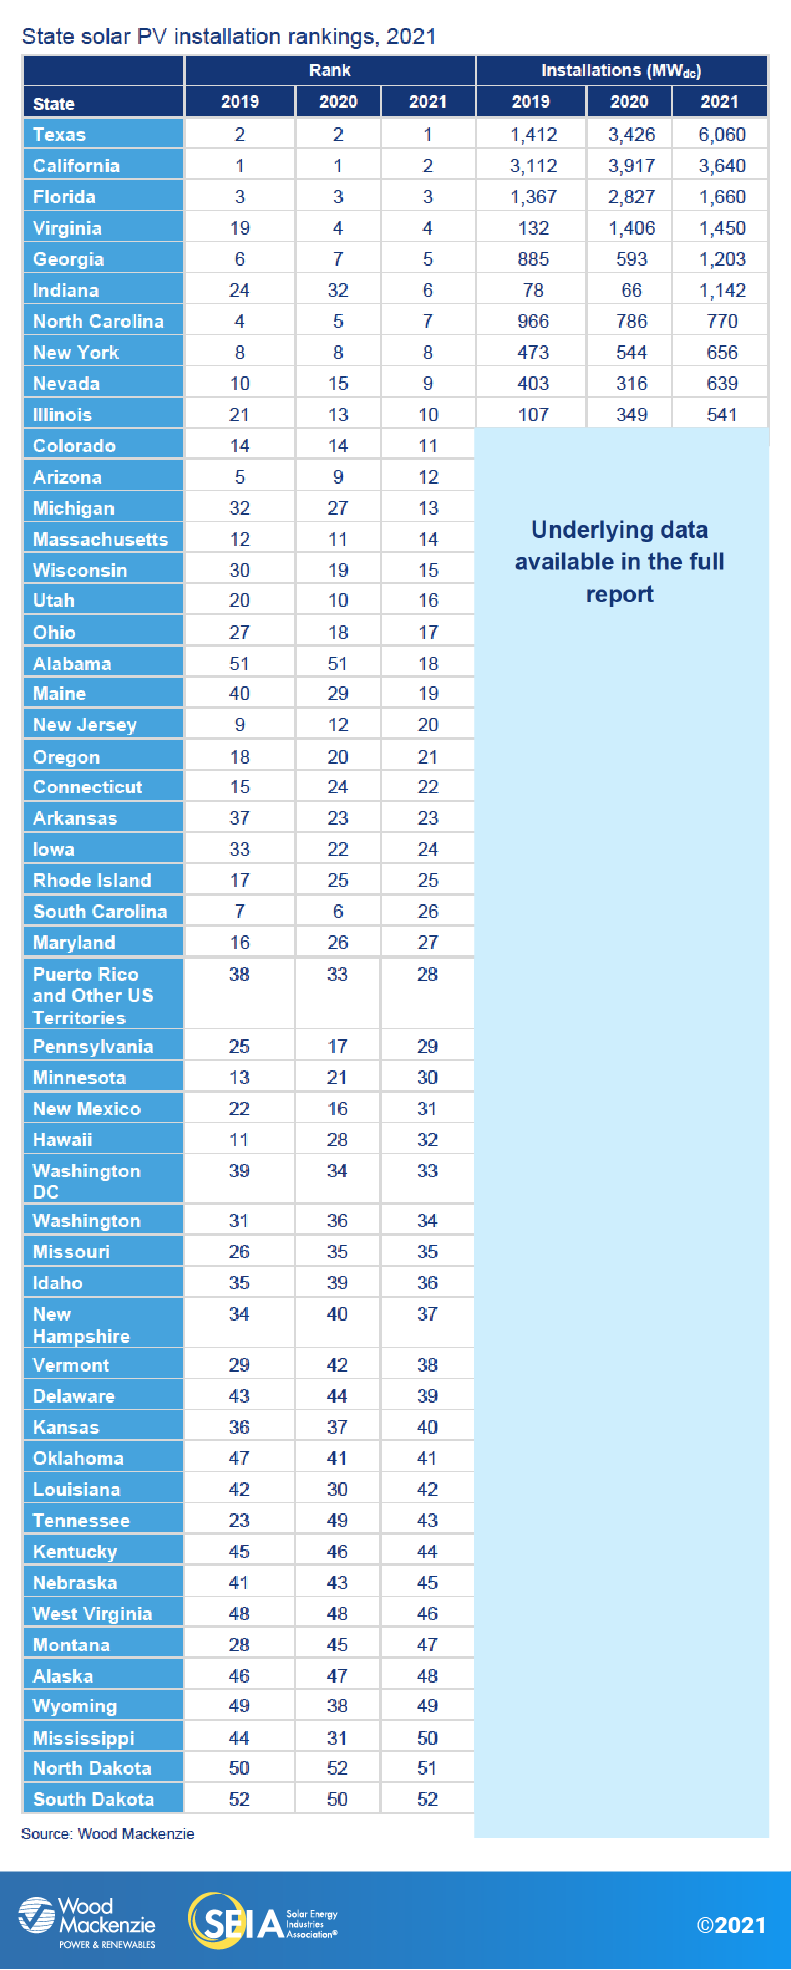
- Texas overtook California as the top-ranked state for solar capacity additions for the first time in 2021, thanks to a strong year for utility solar in the state.
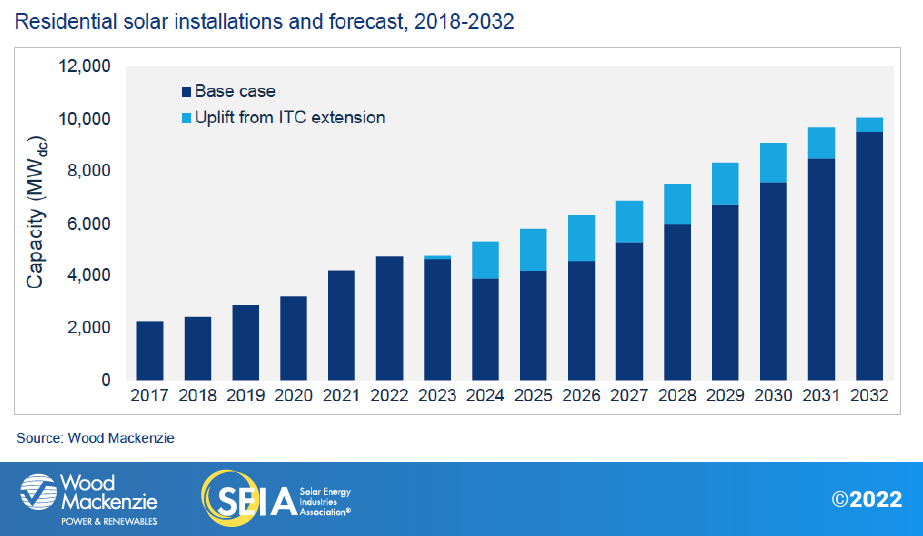
- Residential solar installations totaled 4.2 GWdc in 2021, setting an annual record and exceeding more than 500,000 projects installed in a year for the first time.
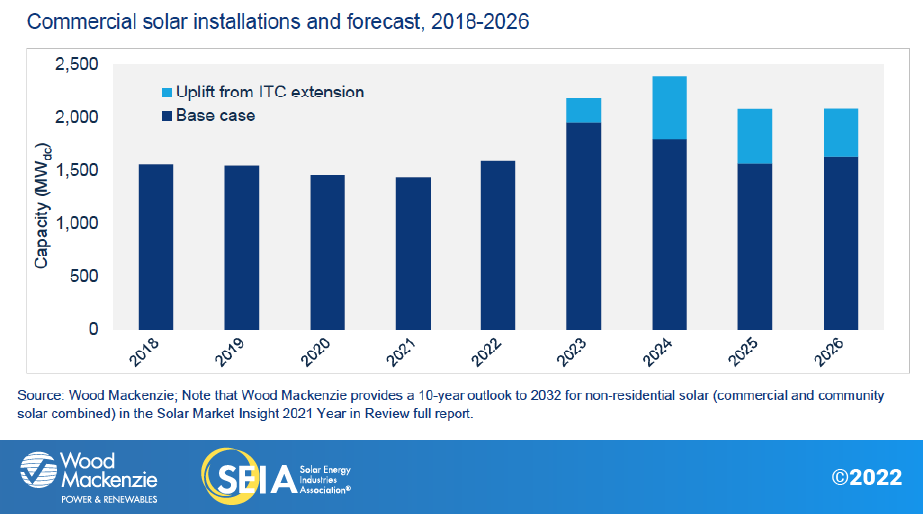
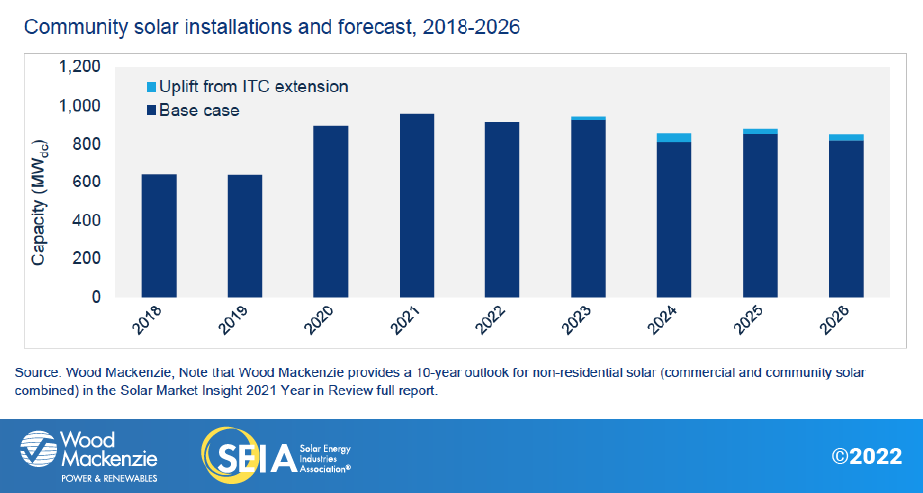
- Community solar volumes reached 957 MWdc, representing 7% year-over-year growth. Commercial solar volumes in 2021 were nearly equal to those in 2020 at 1,435 MWdc. Project delays from interconnection challenges and supply chain constraints limited growth in both sectors.
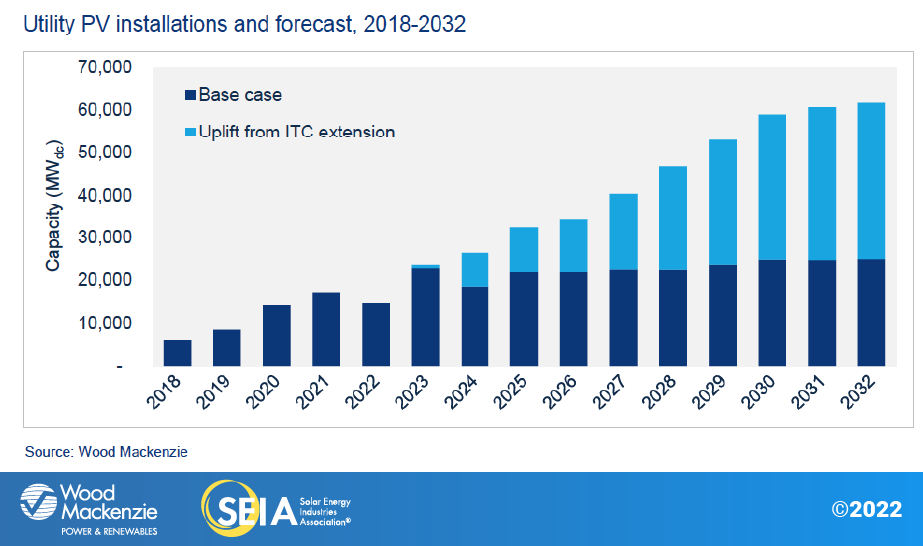
- Utility-scale solar set an annual installation record at nearly 17 GWdc. Despite this record growth, final installations in 2021 were lower than expected due to supply chain constraints, logistics challenges, and trade headwinds. Multiple gigawatts of projects pushed their online dates from 2021 to 2022 or later.
- 2021 was a year of increasing costs for the solar industry. Wood Mackenzie’s tracking began showing consistent year-over-year and quarter-over-quarter price increases starting in Q2 2021, which continued throughout the year. Year-over-year price increases for utility-scale solar reached 18% for fixed-tilt projects and 14.2% for single-axis tracking projects in Q4.
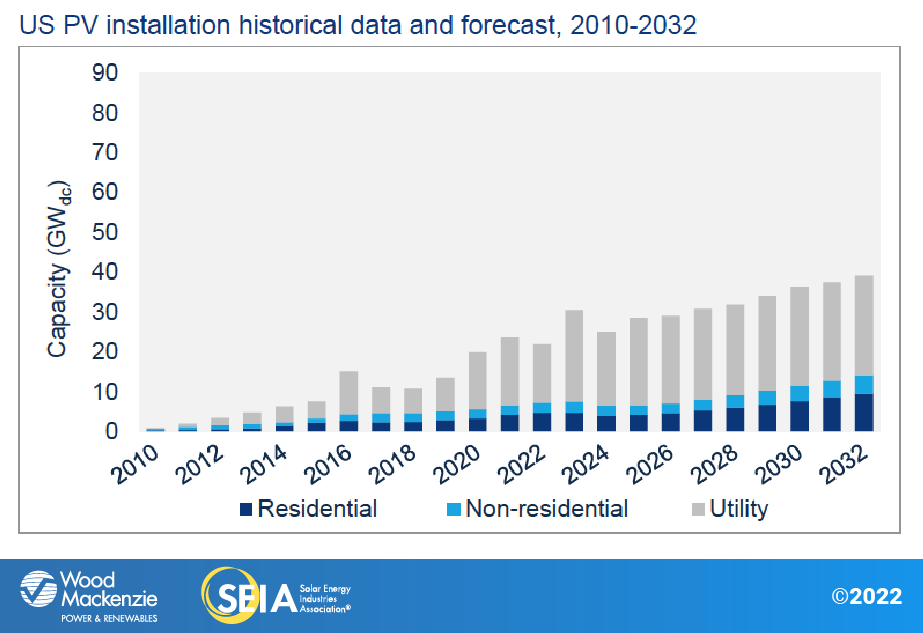
- For this Year in Review report, Wood Mackenzie has released 10-year outlooks for each segment. The solar industry is expected to more than triple from 120 GWdc installed today to 464 GWdc by 2032. This is still far short of what’s needed to hit the Biden administration’s clean energy targets.
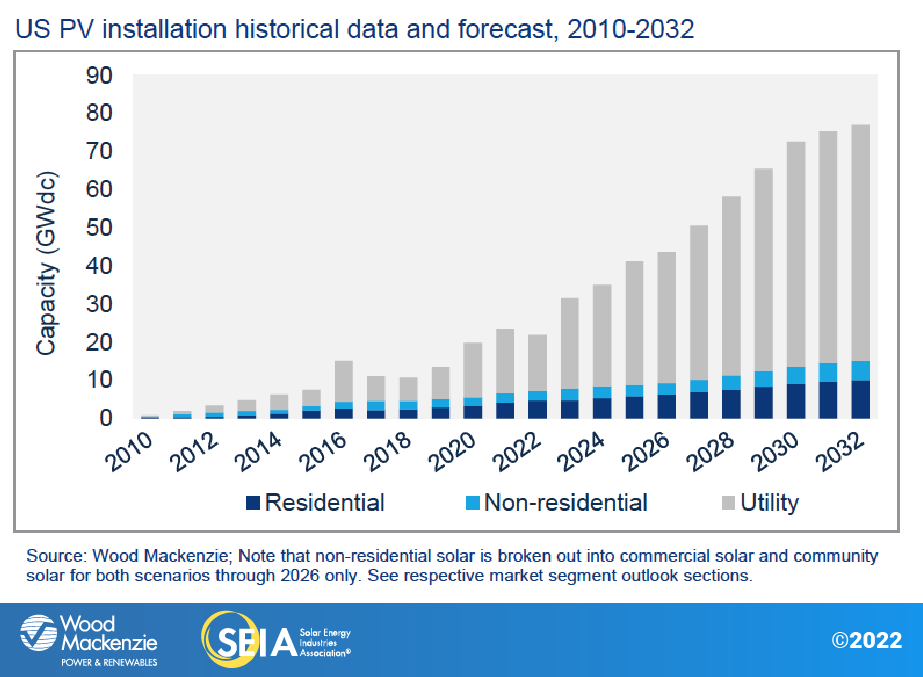
- The industry remains hopeful that the numerous clean energy provisions included in the Build Back Better (BBB) Act will make their way into final legislation. Passage of an Investment Tax Credit (ITC) extension and other clean energy provisions would be a significant solar market catalyst, increasing installations by 66% in the next decade over the base case.
2. Introduction
The US solar industry had another record-setting year in 2021, with 23.6 gigawatts-direct current (GWdc) of capacity installed. Despite numerous challenges throughout 2021, the industry easily exceeded 20 GWdc, and is expected to maintain that level of annual deployment for the foreseeable future.
Demand for solar remained high throughout the year. Residential solar installations exceeded 4 GWdc of capacity and the industry installed more than half a million systems in a single year for the first time. Nearly 5% of viable owner-occupied homes in the US have residential solar installed. Commercial and community solar combined set an annual record at 2.4 GWdc. Utility-scale solar had its biggest year yet at nearly 17 GWdc installed, more than double the utility solar installations from just two years prior.
Overall, solar PV accounted for 46% of all new electricity-generating capacity additions in 2021. This represents the third year in a row that solar has made up the largest share of new generating capacity in the US.
Supply chain constraints and trade headwinds will hit 2022 the hardest
By all accounts, 2021 was another successful year for the US solar industry. However, the industry is not immune to global economic trends. Elevated commodity prices, higher freight costs, and shipping delays that affected most segments of the economy had significant impacts on the solar industry. It was the first year that solar system prices increased consistently year-over-year and quarter-over-quarter for every segment beginning in the second quarter.
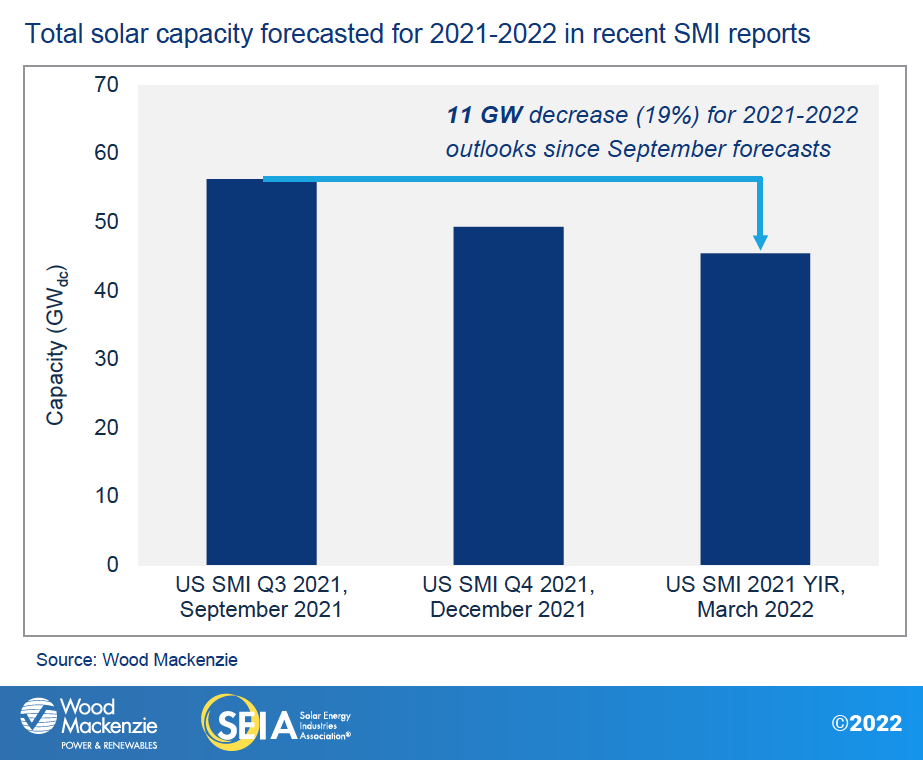
Many of these trends will ultimately impact 2022 installation volumes. Price increases and equipment delays throughout 2021 impacted projects scheduled for 2022 the most. Utility solar installations this year are expected to fall by 14% compared to 2021, thanks to a combination of project cancelations and project delays from 2022 to 2023. Utility solar demand remains high, as demonstrated by the robust project pipeline. But Wood Mackenzie retains a conservative outlook for utility solar due primarily to equipment availability. Overall, our near-term solar forecasts for 2021-2022 have decreased by 11 GWdc, or 19%, since our September US Solar Market Insight Q3 2021 report, highlighting the impacts of supply chain constraints and price increases over the last year.
While distributed solar has been impacted less than utility solar, this year’s expected installations would be higher in the absence of these constraints. The 2022 outlooks for commercial and community solar have been adjusted downward by 15% and 3%, respectively, reflecting the combination of interconnection-related challenges and supply chain constraints. While residential solar growth remains robust, tight equipment supply has led to longer project timelines and prevented even stronger growth for some installers.
Trade issues will also continue to impact the solar supply chain, but with less volatility than late 2021. In early February, the White House extended Section 201 tariffs on solar cells and modules for four years but doubled the tariff-free solar cell import quota from 2.5 GW to 5 GW and maintained the exclusion for bifacial modules. The decision offered some relief to both module assemblers and project developers.
In addition, US Customs and Border Protection released some shipments of solar modules from at least two major manufacturers that were detained under the Hoshine Withhold Release Order (WRO). While this release signals some hope for the industry, WRO compliance remains a top priority for module manufacturers with US exports. Importers continue to carefully prepare traceability documents and re-configure their supply chain to avoid detainments.
The industry is also watching the development of a recent anti-circumvention request filed by Auxin Solar against Vietnam, Malaysia, Thailand, and Cambodia. If the Department of Commerce initiates the case, it will present considerable downside risk and uncertainty for the solar industry. Applying China Antidumping and Countervailing duties (AD/CVD) can more than double the cost of imported modules, the majority of which come from the nations targeted by the request. The Department of Commerce will decide in March whether to take up the case.
California’s NEM 3.0 shapes the distributed solar outlook
When the California Public Utilities Commission (CPUC) released its Proposed Decision (PD) for NEM 3.0 on December 13th, 2021, it instigated intense debates about appropriate policy for distributed solar compensation. The provisions of the PD were considerably worse for solar project economics than industry expectations. Since the release of the PD, much has changed. The new CPUC president, Alice Reynolds, has formally announced that the commission needs more time to review and consider the NEM 3.0 case. While there is little doubt that a revised proposal will be issued, it is much less clear how significant any modifications will be for project economics.
To demonstrate the potential impacts of the PD, Wood Mackenzie has included the proposed provisions in its forecasts for California’s distributed solar markets. Unsurprisingly, these policy changes are the single largest factor influencing our outlooks for the state’s residential and commercial solar growth. Payback periods for projects in both segments would lengthen beyond 10 years. As a result, both residential and commercial solar markets are expected to decline by about half within the next few years. And since California remains the largest distributed solar market in the US, these reductions result in nationwide market contraction for both segments starting in 2023. More detailed analysis on this topic is provided in the full report.
Federal clean energy incentives remain in limbo
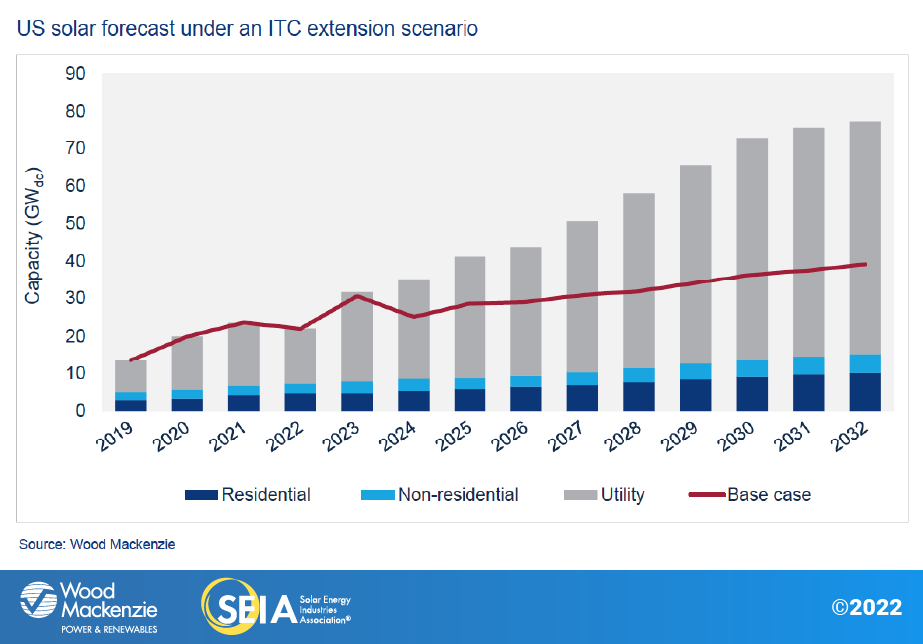
It appears unlikely that the BBB Act will pass in its current form. That said, the solar industry is hopeful that the numerous clean energy incentives included in the bill will be passed in some fashion. The most important incentives include an extension and expansion of the ITC and Production Tax Credit (PTC), a new standalone storage ITC, tax credits for solar manufacturing, and direct payment options for tax credits. As part of this Year in Review report, Wood Mackenzie has included 10-year outlooks for both a base case scenario and a scenario assuming these federal clean energy incentives become law (referred to throughout as the “ITC extension scenario”).
Similar to results published in the US Solar Market Insight Q4 2021 report, an ITC extension scenario would be a major catalyst for the industry, increasing capacity installations over the next decade by 66%. This represents a 20% increase for residential, 15% for non-residential (commercial and community solar), and 86% for utility solar. The solar fleet by 2032 would be nearly 700 GWdc compared to 464 GWdc in the base case.
Without the passage of these clean energy incentives, the solar industry will be far off from what’s needed to hit the nation’s 2035 decarbonization goals.
3. Market segment outlooks
3.1. Residential PV
Key figures
- 4.2 GWdc and 514,000 systems installed in 2021, 1,156 MWdc in Q4 2021
- Up 30% from 2020
The US residential solar industry broke records in 2021 as consumer demand remains higher than ever. The market added 1,156 MWdc in Q4 to reach 4.2 GWdc of annual installed capacity, representing both quarterly and annual records. Installers completed more than 500,000 projects in 2021, the first time the segment has achieved this annual milestone. Residential solar installations grew 30% year-over-year, the highest annual growth rate since 2015.
The industry achieved all this despite elevated component pricing and supply chain issues worsening throughout the year. Many industry players continued to experience tight module and battery availability during Q4 and heading into 2022. So far, signs point to a similar story this year.
Even so, the market is managing to grow through these struggles. Wood Mackenzie forecasts 13% growth for residential solar in 2022, with upside if installers start to see supply chain relief. NEM 3.0 in California and the expiration of the ITC heavily impact our base case outlook from 2023 onward. With California volumes set to fall by 45% in the first full year of NEM 3.0, we forecast the entire market will contract by 2% in 2023. The market, excluding California, will grow by 18% during the same time period. An ITC extension increases our residential outlook by nearly 13 GWdc, or 21%, from 2023 to 2032.
3.2. Commercial PV
Key figures
- 1,435 MWdc installed in 2021, 397 MWdc in Q4 2021
- Down 1% from 2020
Note on market segmentation: Commercial solar encompasses distributed solar projects with commercial, industrial, agricultural, school, government or nonprofit offtakers, including remotely net-metered projects. This excludes community solar (covered in the following section).
After installing 397 MWdc in the fourth quarter, the commercial solar industry ended the year with 1,435 MWdc – nearly on par with 2020 volumes. More projects would have been completed had it not been for supply chain constraints or interconnection delays. Commercial solar developers report there will be project spillover into 2022. Double-digit growth in commercial solar volumes is expected for the next two years thanks to a combination of project spillover from 2021 to 2022, demand pull-in from the current ITC schedule, and numerous state-level policy programs.
It is hard to understate the impact of California’s NEM 3.0 policy on the shape of the commercial solar outlook. While industry conversation has focused heavily on residential solar, NEM 3.0 will also have a dramatic impact on commercial solar. The current PD will result in longer project paybacks and broad industry contraction, causing a 37% decline of over 1,500 MWdc compared to the prior outlook for 2022-2026.
With the passage of federal clean energy incentives, the commercial solar forecast would increase by 21% from 2022-2026 compared to the base case. While small and medium commercial solar will benefit from new refundability provisions for the tax credit, state incentive program fluctuations and interconnection challenges continue to have an outsized impact on commercial solar markets.
3.3. Community solar PV
Key figures
- 957 MWdc installed in 2021, 355 MWdc in Q4 2021
- Up 7% from 2020
Note on market segmentation: Community solar projects are part of formal programs where multiple customers can subscribe to the power produced by a local solar project and receive credits on their utility bills.
The community solar industry had a record-setting year in 2021, installing 957 MWdc. Installations in Q4 2021 dropped year-over-year but significantly grew quarter-over-quarter. New York dominated the national community solar market in 2021, accounting for nearly two-thirds of capacity in the final quarter. Total community solar capacity is expected to more than double over the next five years, with considerable upside if new state programs are created and current programs are expanded.
We have decreased the Maine outlook due to continued cluster study delays that inhibit projects from moving forward. Projects from New Jersey’s community solar pilot program started coming online this year, but siting constraints and difficulties with meeting low- and moderate-income subscriber requirements are suppressing growth, leading to forecast reductions. Meanwhile, New York’s new distributed generation commitments and proposed Solar Roadmap have led us to increase the state’s outlook by 11%.
If federal clean energy incentives are passed, it would result in a small 3% uplift for community solar from 2022-2026 compared to the base case. This is because community solar growth is more closely tied to the success of state-level programs than the other market segments. In markets with large project pipelines, extended tax credits would improve the viability of projects that already qualify for program capacity. But program expansions require state policy action. Over the long term, the enhanced economics offered by an extended ITC could motivate more states to add community solar programs.
3.4. Utility PV
Key figures
- 17 GWdc installed in 2021, 5.9 GWdc in Q4 2021
- 4.6 GWdc of new utility-scale solar contracts were signed in Q4, causing the total pipeline to reach 80.2 GWdc by year-end 2021
The utility-scale solar sector reached unprecedented growth in 2021 in the face of ongoing supply chain constraints and price volatility. During the last quarter of the year, 5.9 GWdc of projects came online, bringing 2021 capacity to a record-breaking 17 GWdc. In Q4, 4.6 GWdc of new contracts were signed, leaving the total pipeline at 80.2 GWdc.
Despite the large project pipeline, volatile commodity prices and supply chain uncertainty continue to put projects at risk. About one-third of the capacity slated to come online during Q4 2021 was delayed by at least a quarter. For the 2022 pipeline, developers have postponed at least 8% of planned capacity to 2023 or later and canceled at least 5%. As supply chains continue to face backlogs and delays, Wood Mackenzie remains conservative about equipment supply availability, maintaining the 2022 buildout at about 15 GWdc.
However, these headwinds are unlikely to outweigh demand for the utility-scale solar segment in the long run. Ongoing efforts to expand federal clean energy support, increasing interest in ESG investments, and new procurement strategies will allow industry recovery in 2023. Under the current policy environment, utility-scale solar will continue to grow in the double-digits, adding a total of 123 GWdc by 2027 and 244 GWdc by 2032. If federal clean energy incentives are passed, including the proposed extensions and modifications to tax credits, the utility solar industry would install an additional 210 GWdc by 2032 for a total of 454 GWdc between 2022 and 2032.
4. U.S. solar PV forecasts
Base case forecasts
ITC extension forecasts
5. National solar PV system pricing
We employ a bottom-up modeling methodology to capture, track and report national average PV system pricing by segment for systems installed each quarter. Our methodology is based on the tracked wholesale pricing of major solar components and data collected from industry interviews. We report a weighted average of standard mono-PERC and high-efficiency modules for all market segments. Wood Mackenzie assumes all product is procured and delivered in the same year as the installation.
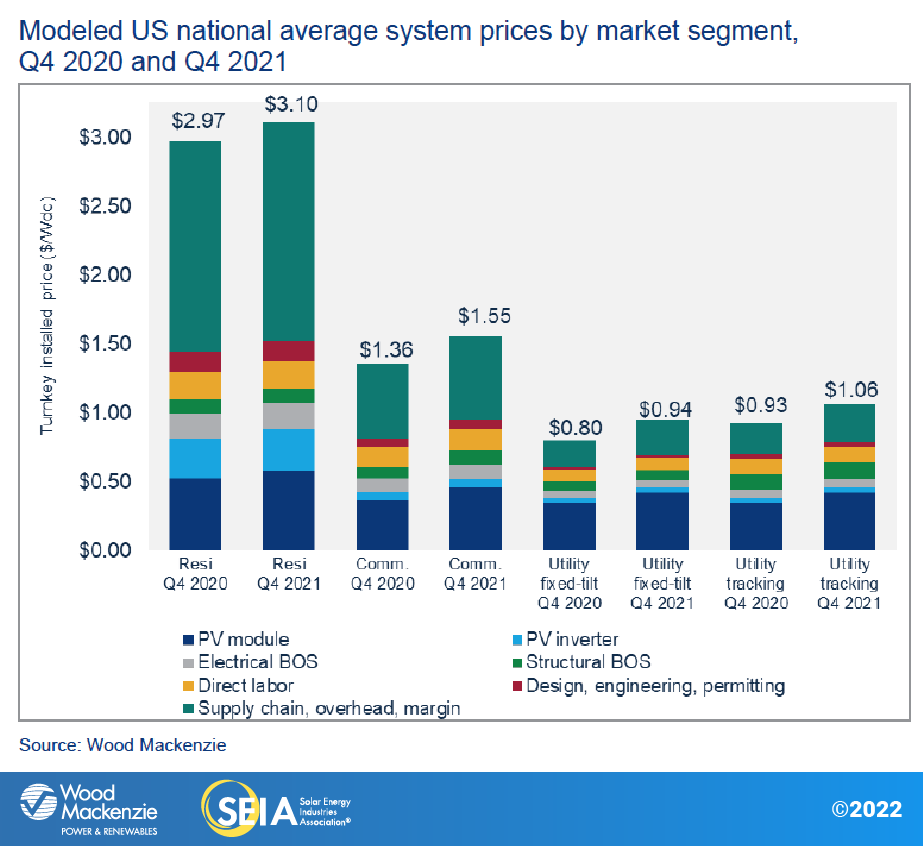
In Q4 2021, system prices increased year-over-year across all market segments. System pricing increased quarter-over-quarter by 1.1% and 4.4% for residential and commercial solar, respectively, fell 0.3% for utility fixed-tilt, and was flat for utility single-axis tracking. Average system prices continue to increase due to rising equipment costs, raw material input and freight costs, as well as labor shortages. Prices for commercial and utility fixed-tilt projects continue to increase as manufacturers continue to pass the cost of increased raw materials to the end user. The growth of the utility single-axis tracker market has led to increased adoption of bifacial modules as well as large format modules, which helps to partially offset other price increases through system efficiencies.
About the Report
U.S. solar market insight® is a quarterly publication of Wood Mackenzie and the Solar Energy Industries Association (SEIA)®. Each quarter, we collect granular data on the U.S. solar market from nearly 200 utilities, state agencies, installers and manufacturers. This data provides the backbone of this U.S. Solar Market Insight® report, in which we identify and analyze trends in U.S. solar demand, manufacturing and pricing by state and market segment over the next five to ten years. All forecasts are from Wood Mackenzie, Limited; SEIA does not predict future pricing, bid terms, costs, deployment or supply. The report includes all 50 states and Washington, D.C. National totals reported also include Puerto Rico and other U.S. territories. Detailed data and forecasts for 50 states and Washington, D.C. are contained within the full version of the report.
References and Contact
-
References, data, charts and analysis from this executive summary should be attributed to “Wood Mackenzie/SEIA U.S. solar market insight®.”
-
Media inquiries should be directed to Wood Mackenzie’s PR team ([email protected]) and Morgan Lyons ([email protected]) at SEIA.
-
All figures are sourced from Wood Mackenzie. For more detail on methodology and sources, click here.
About the Authors
Wood Mackenzie Power & Renewables | U.S. Research Team
Michelle Davis, Principal Analyst (lead author)
Bryan White, Solar Analyst
Rachel Goldstein, Solar Analyst
Sylvia Leyba Martinez, Senior Analyst
Sagar Chopra, Solar Analyst
Kelsey Gross, Solar Analyst
Matthew Sahd, Research Associate
Xiaojing Sun, Head of Global Solar
Solar Energy Industries Association | SEIA
Shawn Rumery, Director of Research
Colin Silver, Chief of Staff and Chief Content Officer
Justin Baca, Vice President of Markets & Research
Note on U.S. solar market insight report title: The report title is based on the quarter in which the report is released, not the most recent quarter of installation figures.
License
Ownership rights
This report ("Report") and all Solar Market Insight® ("SMI")TM reports are jointly owned by Wood Mackenzie and the Solar Energy Industries Association (SEIA)®(jointly, "Owners") and are protected by United States copyright and trademark laws and international copyright/intellectual property laws under applicable treaties and/or conventions. Purchaser of Report or other person obtaining a copy legally ("User") agrees not to export Report into a country that does not have copyright/intellectual property laws that will protect rights of Owners therein.
Grant of license rights
Owners hereby grant user a non-exclusive, non-refundable, non-transferable Enterprise License, which allows you to (i) distribute the report within your organization across multiple locations to its representatives, employees or agents who are authorized by the organization to view the report in support of the organization’s internal business purposes, and (ii) display the report within your organization’s privately hosted internal intranet in support of your organization’s internal business purposes. Your right to distribute the report under an Enterprise License allows distribution among multiple locations or facilities to Authorized Users within your organization.
Owners retain exclusive and sole ownership of this report. User agrees not to permit any unauthorized use, reproduction, distribution, publication or electronic transmission of any report or the information/forecasts therein without the express written permission of Owners.
Disclaimer of warranty and liability
Owners have used their best efforts in collecting and preparing each report.
Owners, their employees, affiliates, agents, and licensors do not warrant the accuracy, completeness, correctness, non-infringement, merchantability, or fitness for a particular purpose of any reports covered by this agreement. Owners, their employees, affiliates, agents, or licensors shall not be liable to user or any third party for losses or injury caused in whole or part by our negligence or contingencies beyond Owners’ control in compiling, preparing or disseminating any report or for any decision made or action taken by user or any third party in reliance on such information or for any consequential, special, indirect or similar damages, even if Owners were advised of the possibility of the same. User agrees that the liability of Owners, their employees, affiliates, agents and licensors, if any, arising out of any kind of legal claim (whether in contract, tort or otherwise) in connection with its goods/services under this agreement shall not exceed the amount you paid to Owners for use of the report in question.